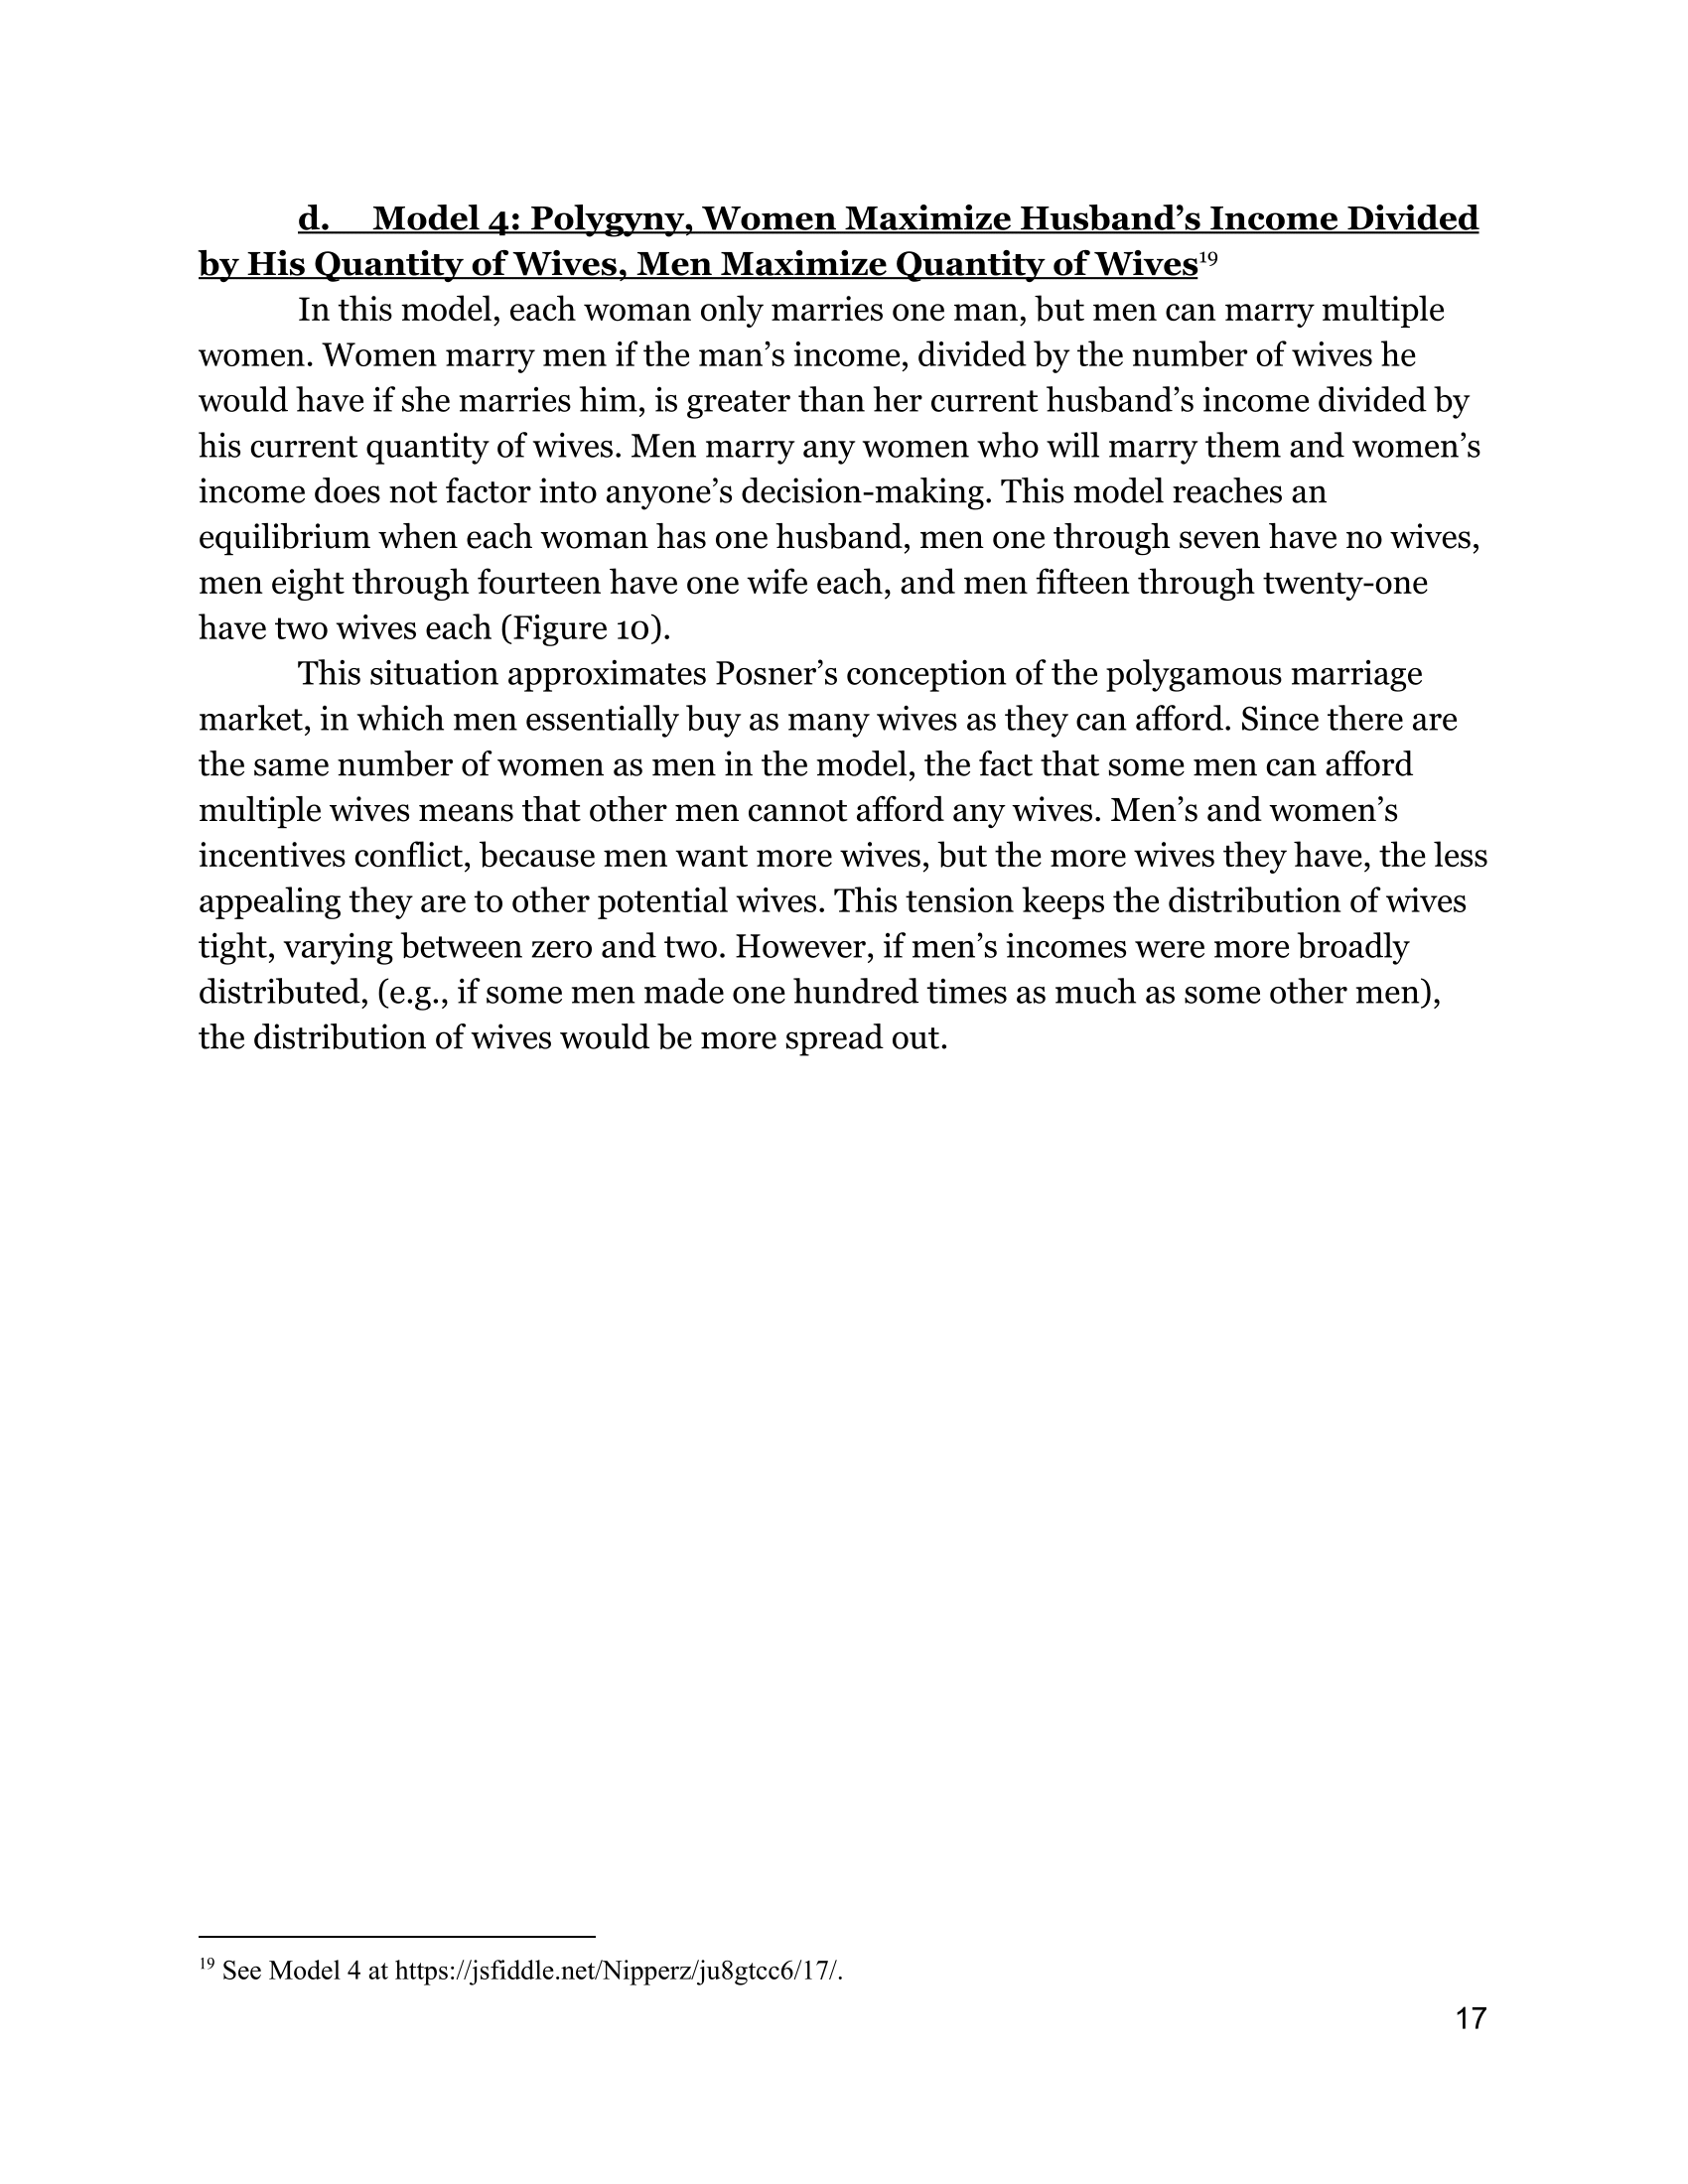
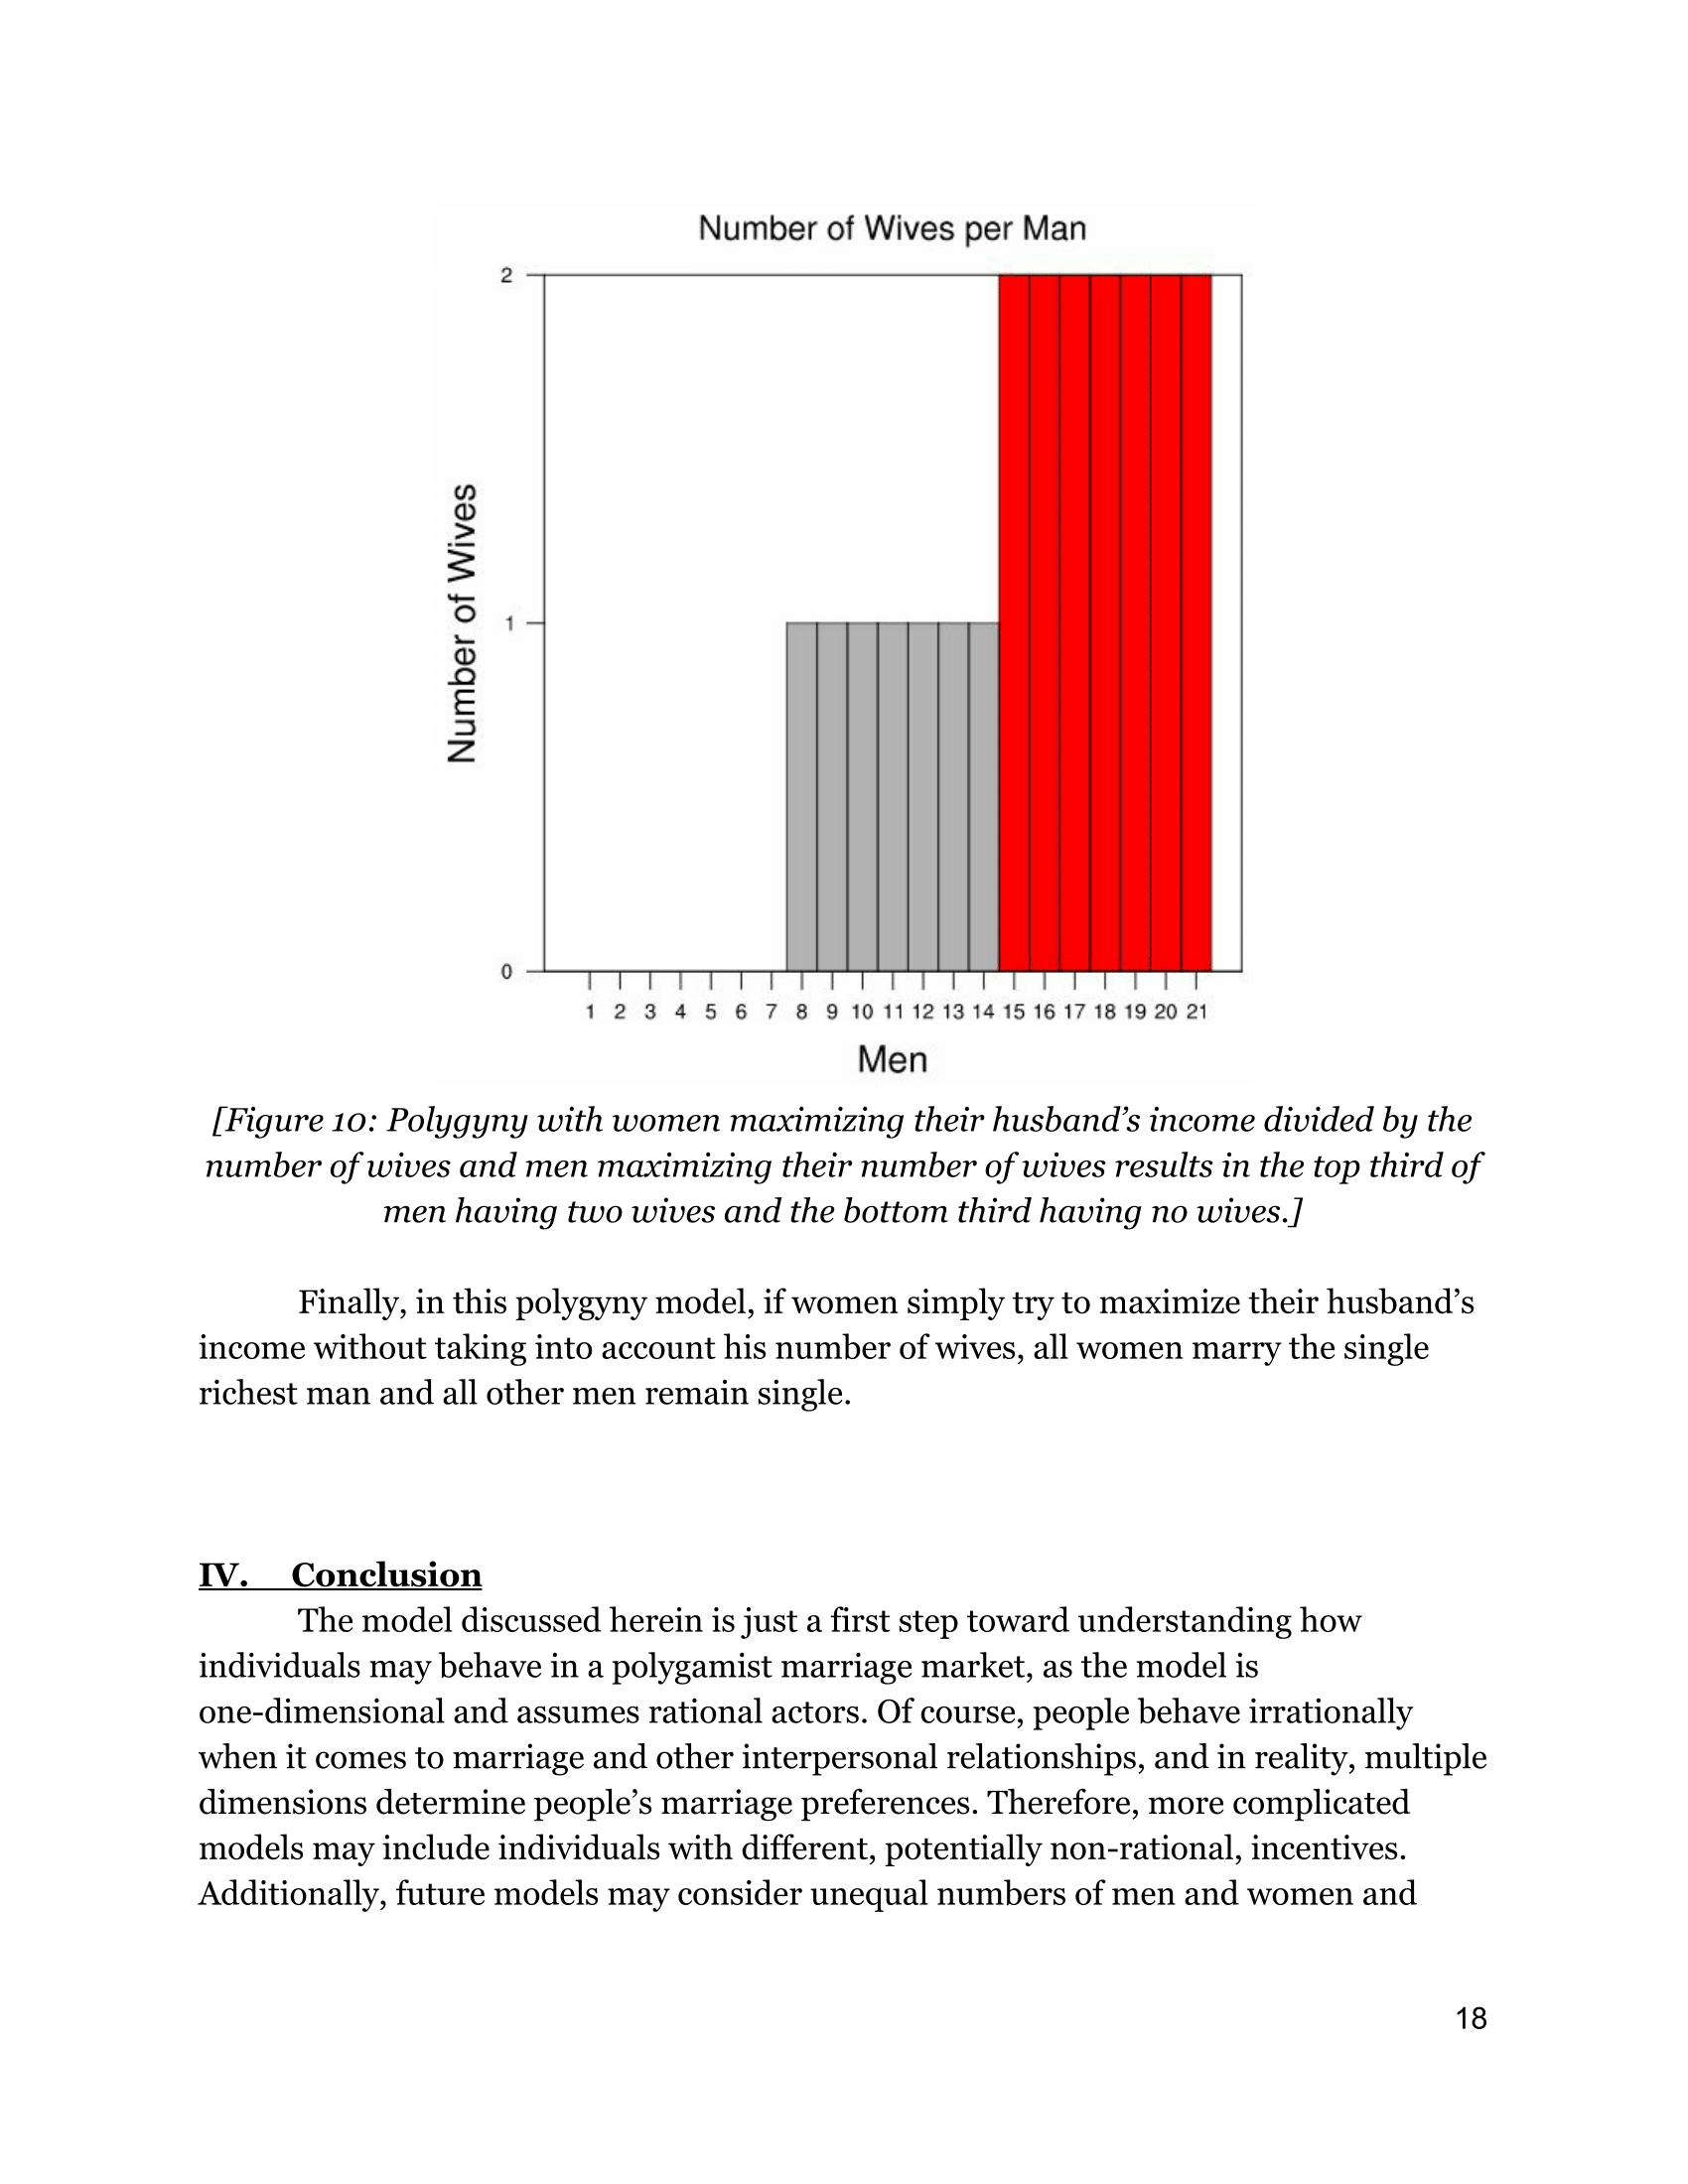
Everyone wants to maximize the number of people to whom they are married.
Results:
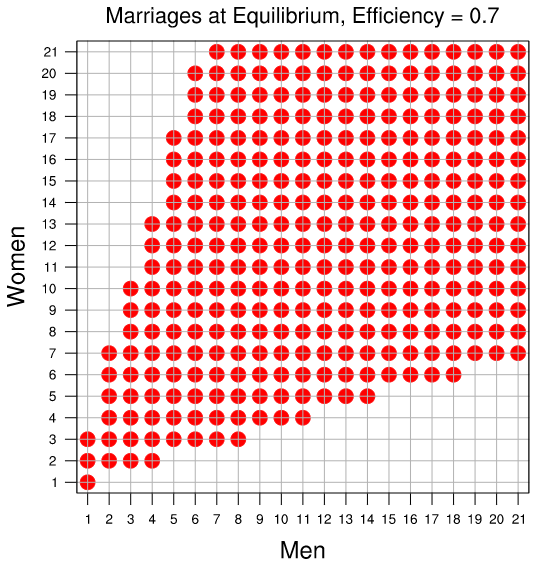
This model reaches equilibrium when all women are married to all men.
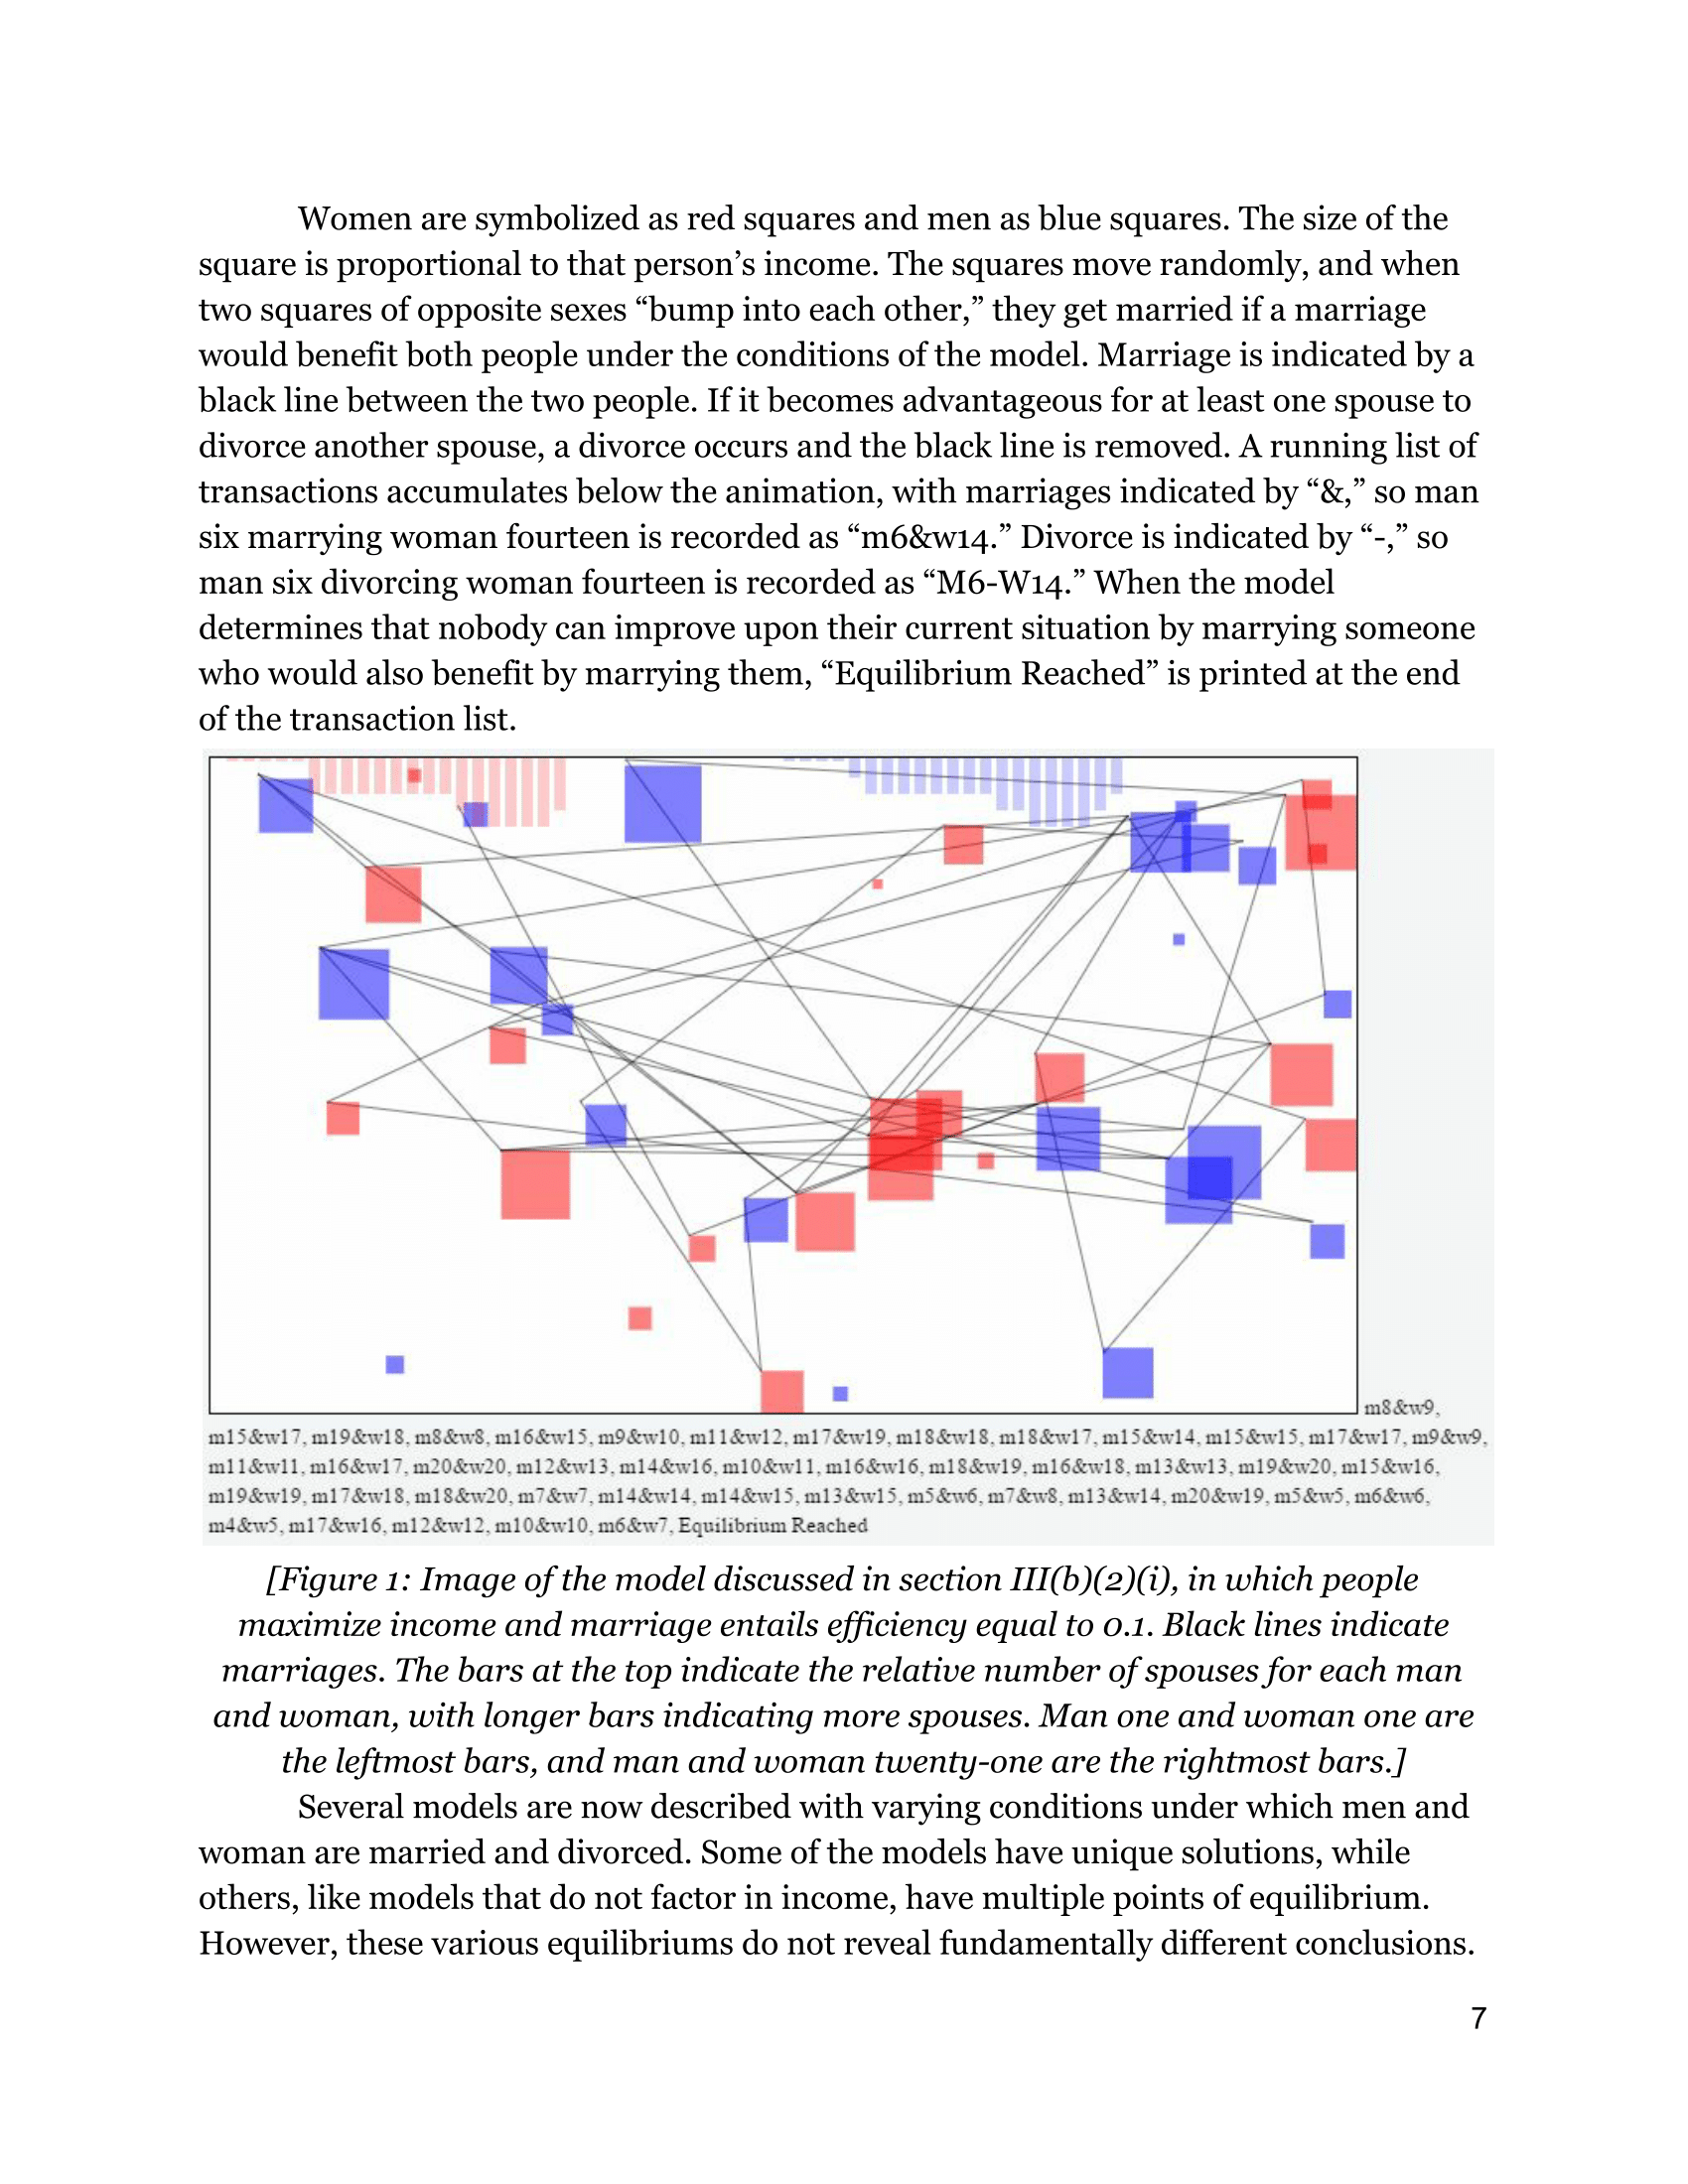
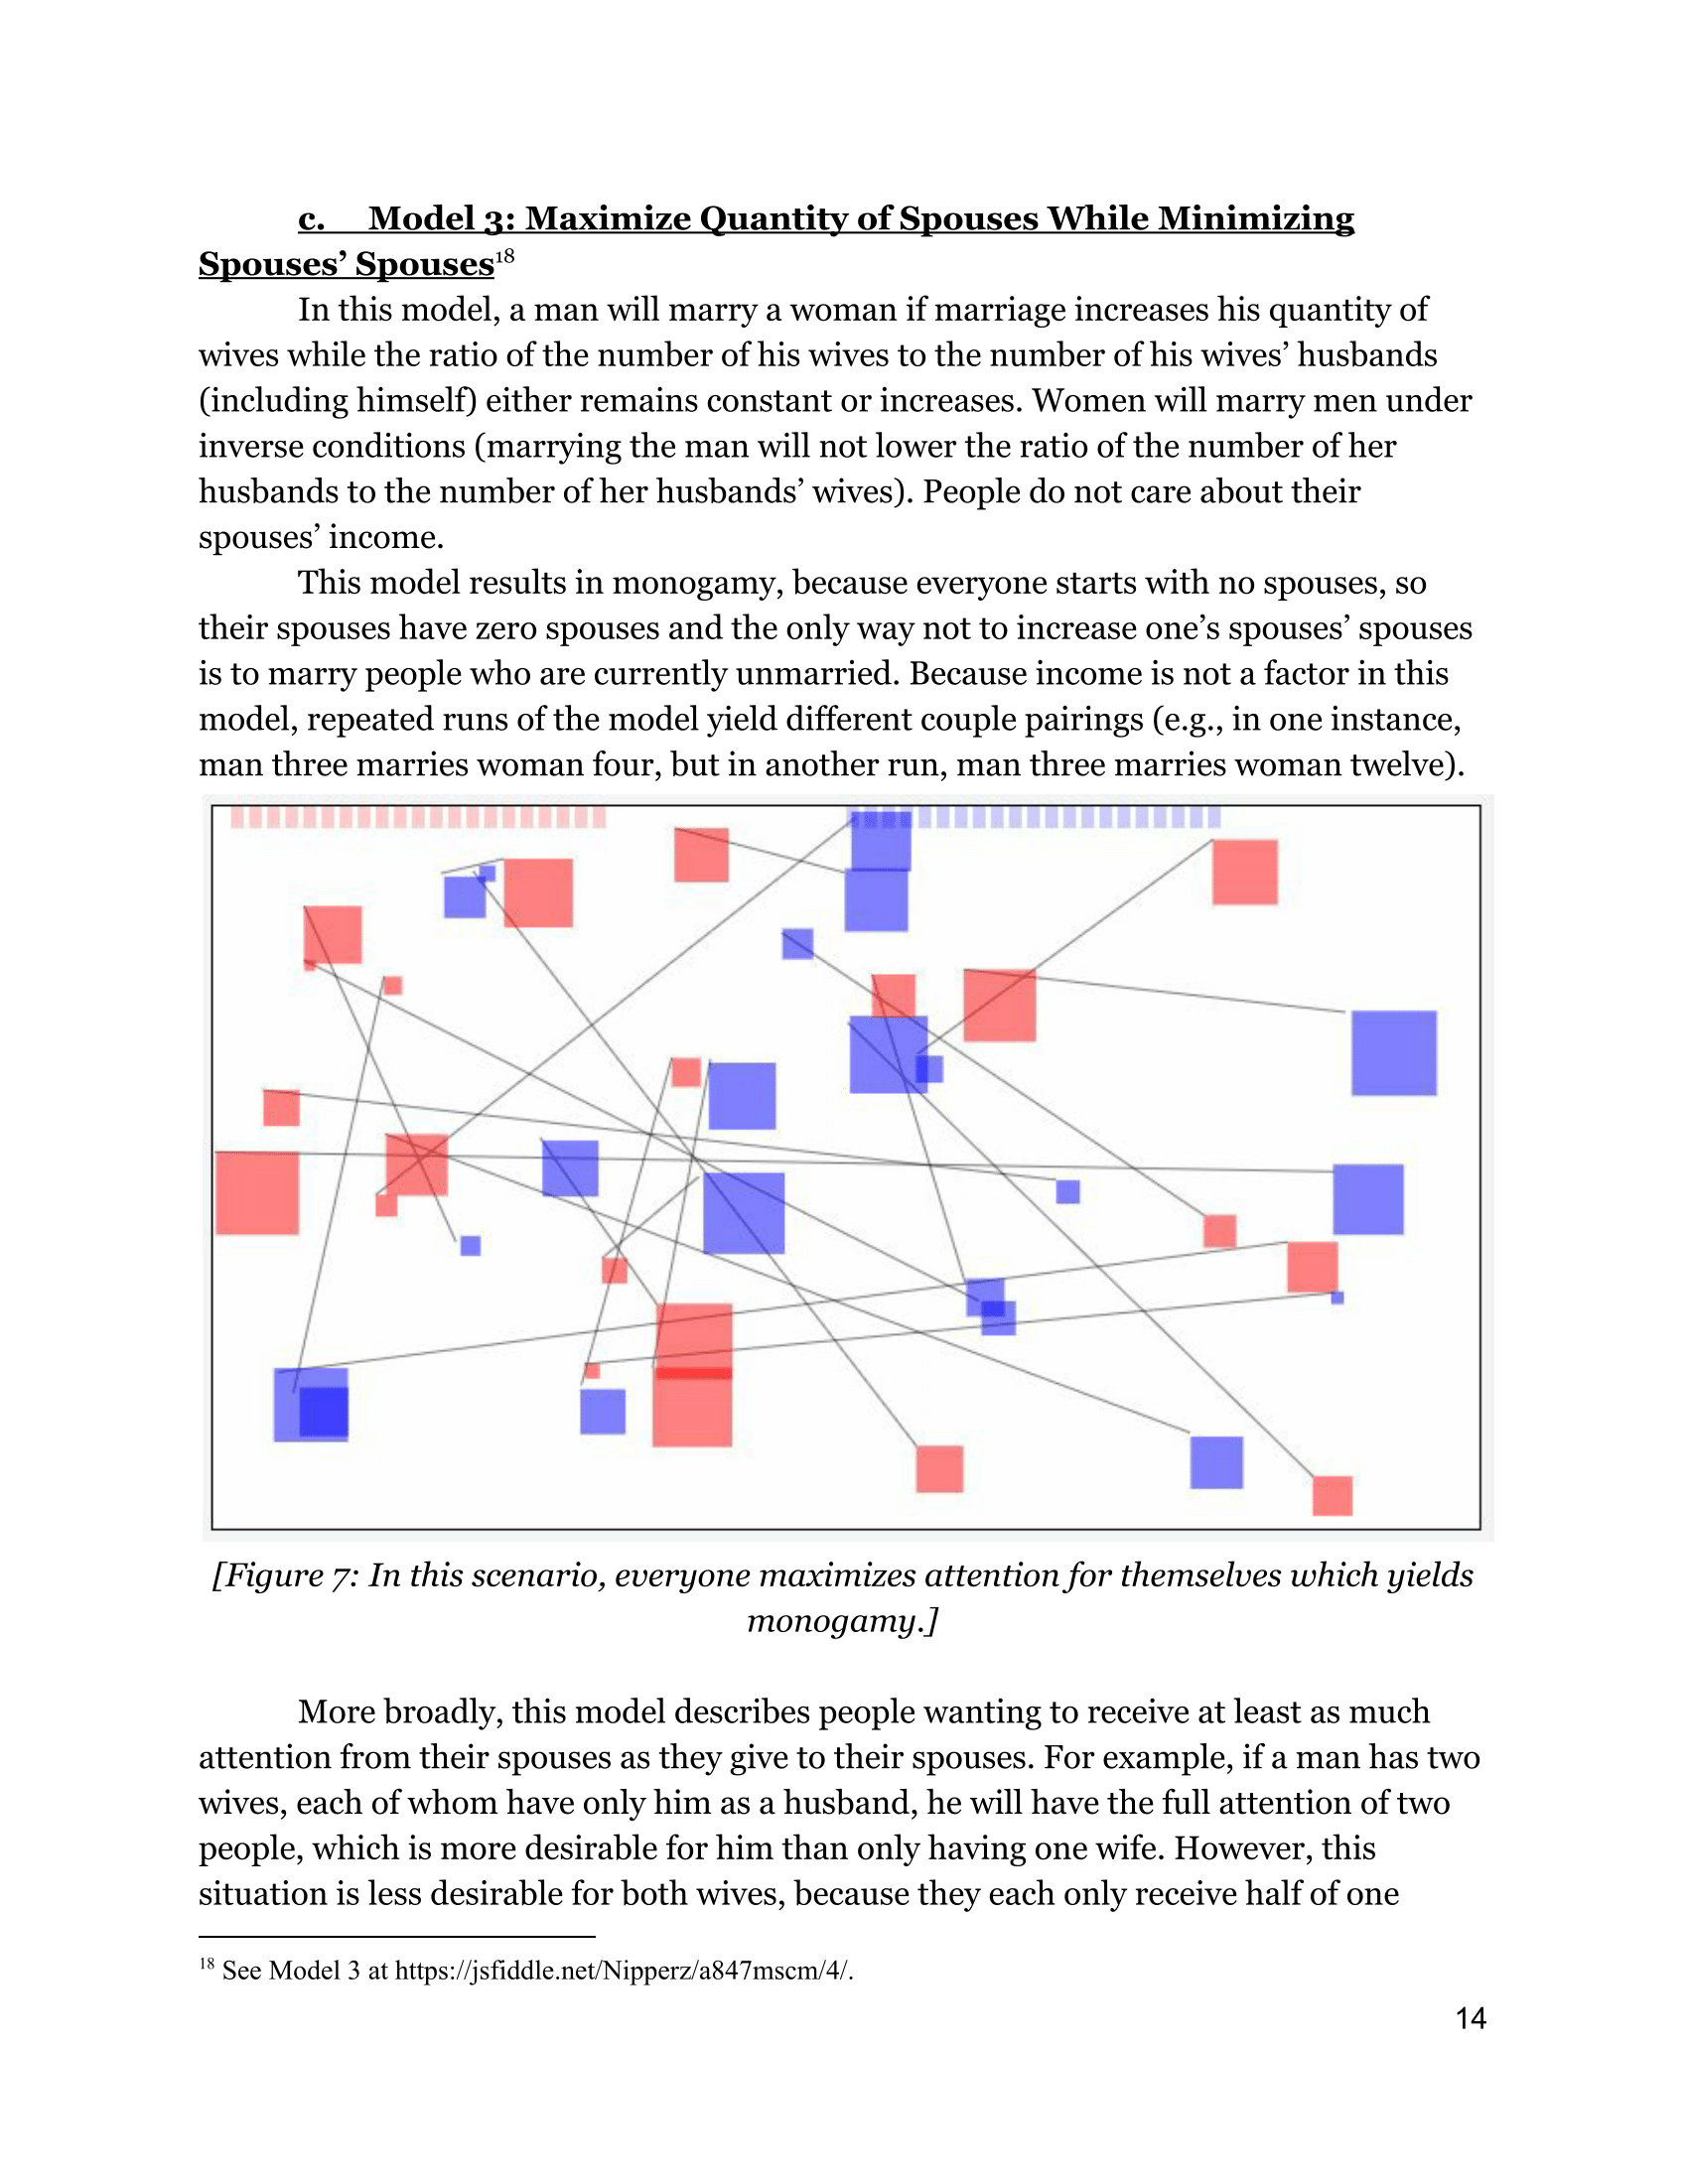
Each red square represents a woman and each blue square represents a man.
The size of the square represents income; larger squares make more money than smaller squares.
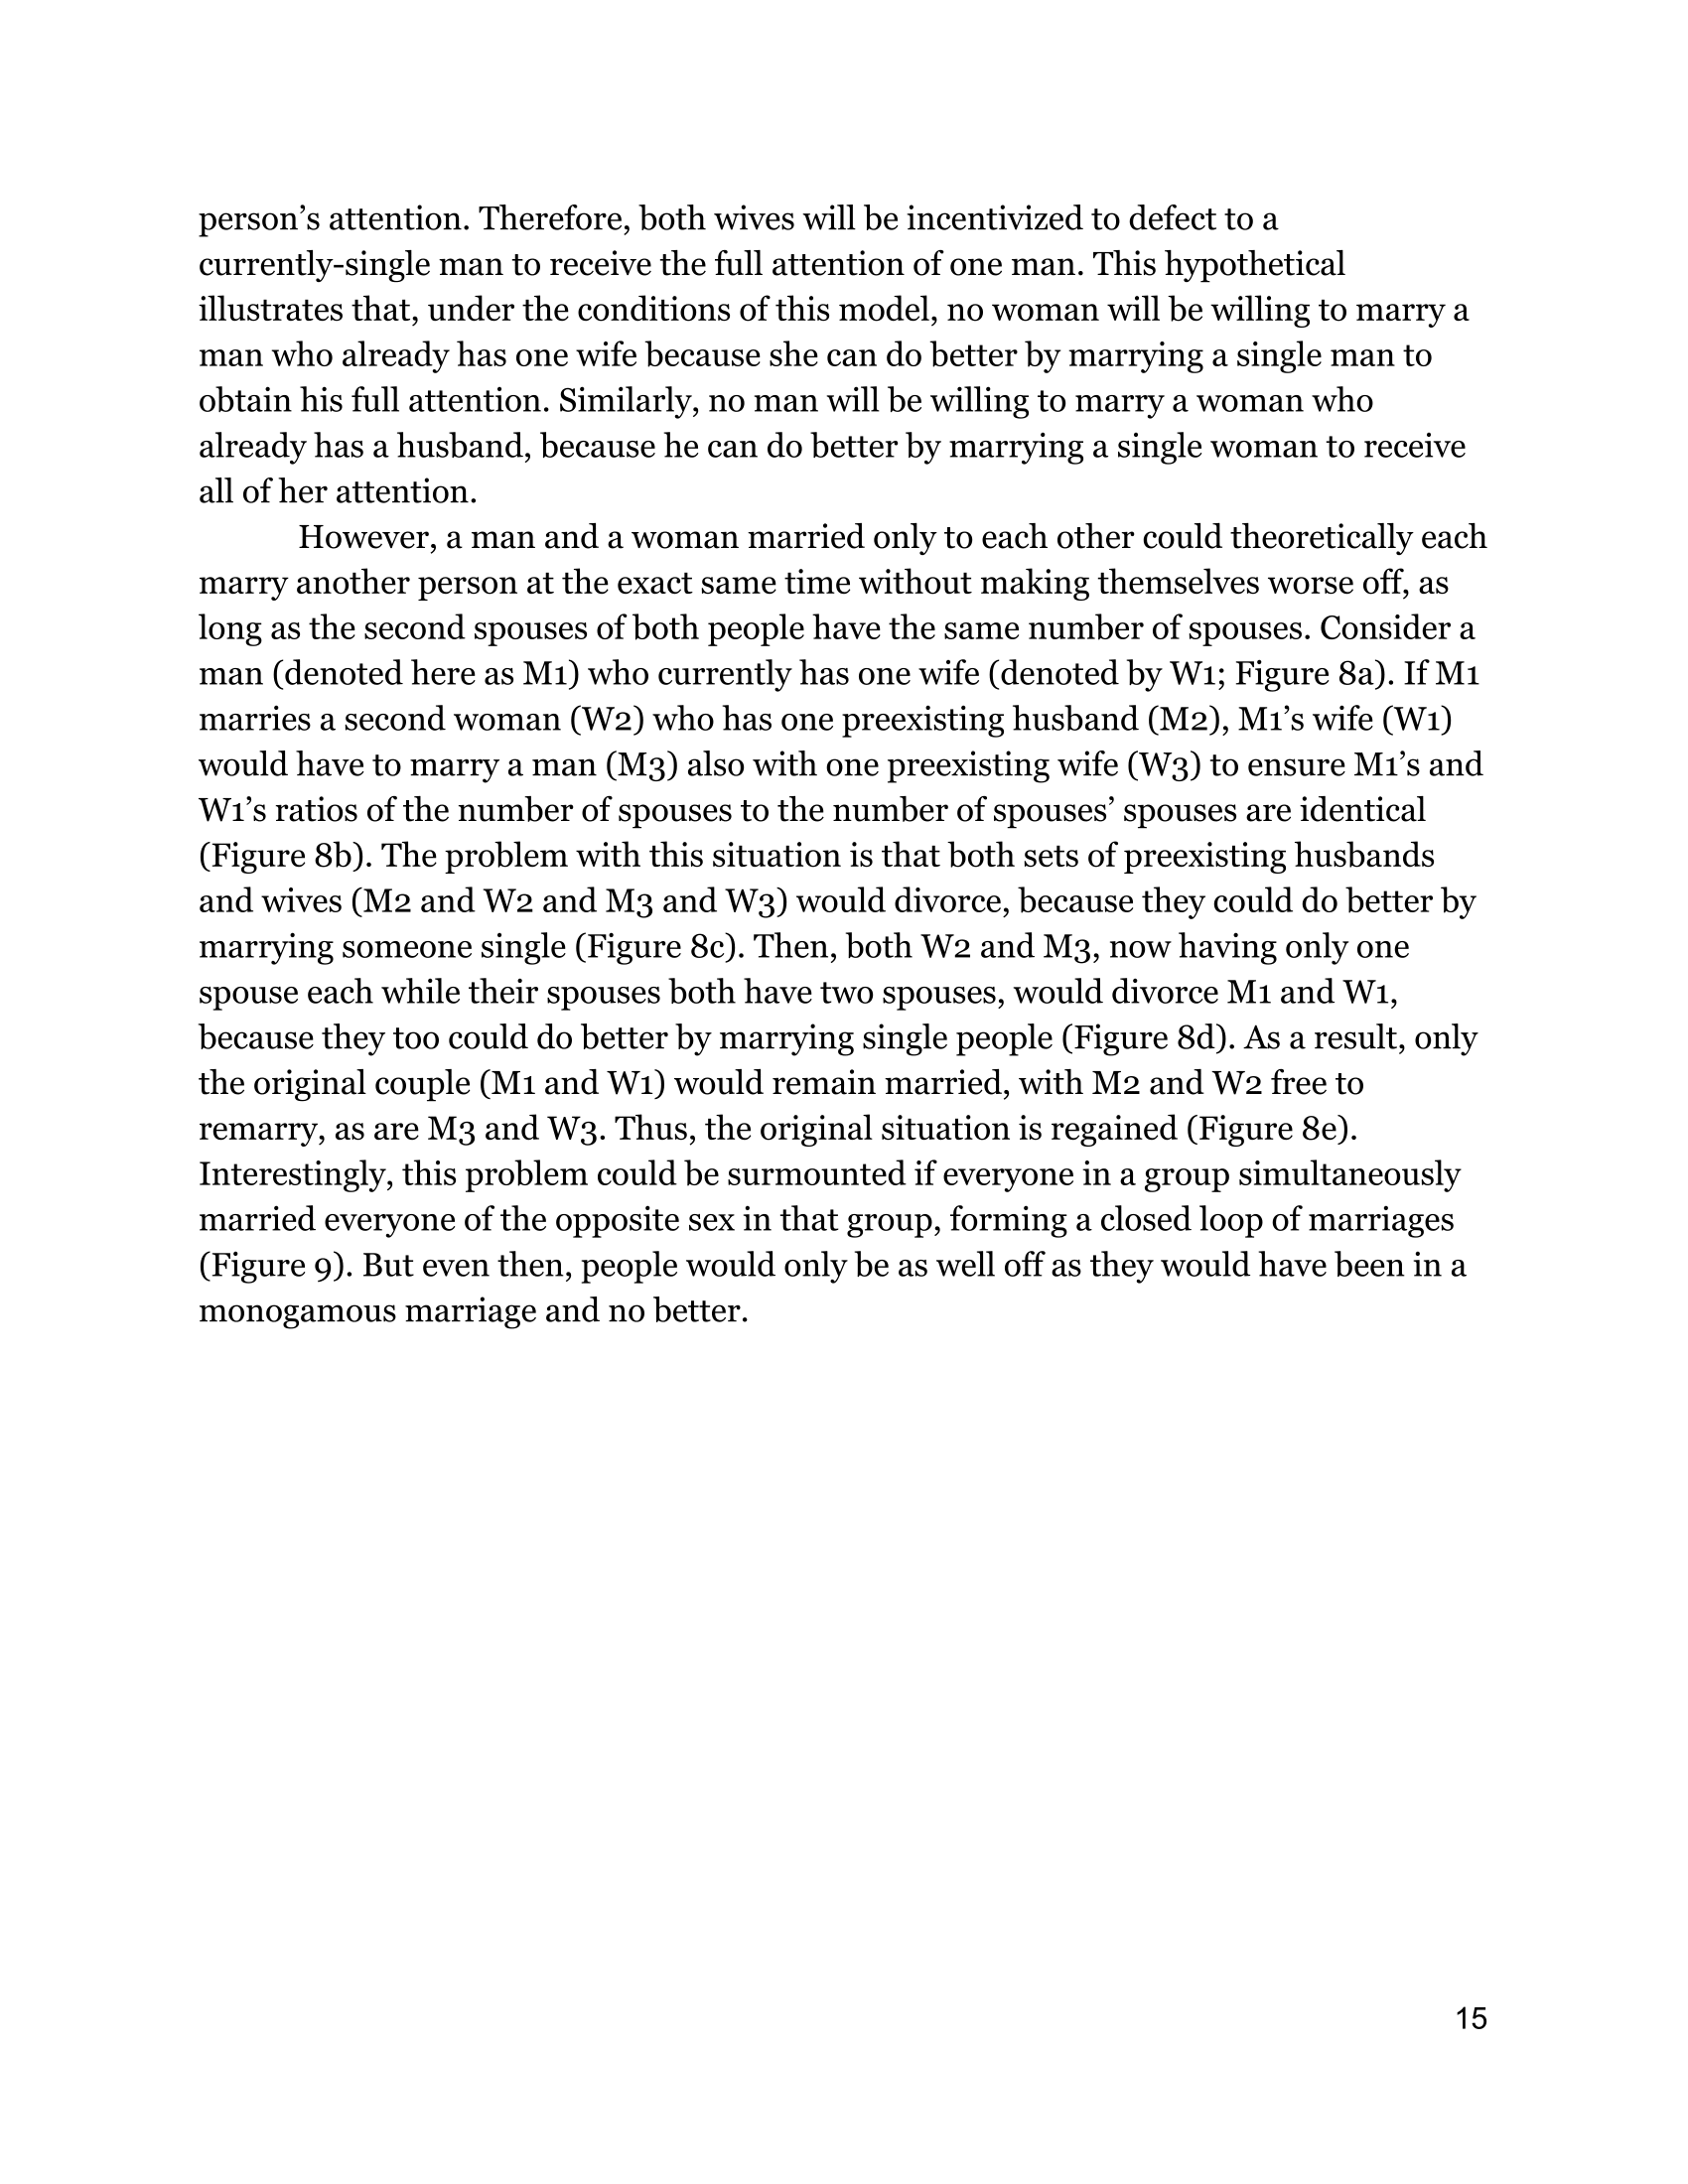
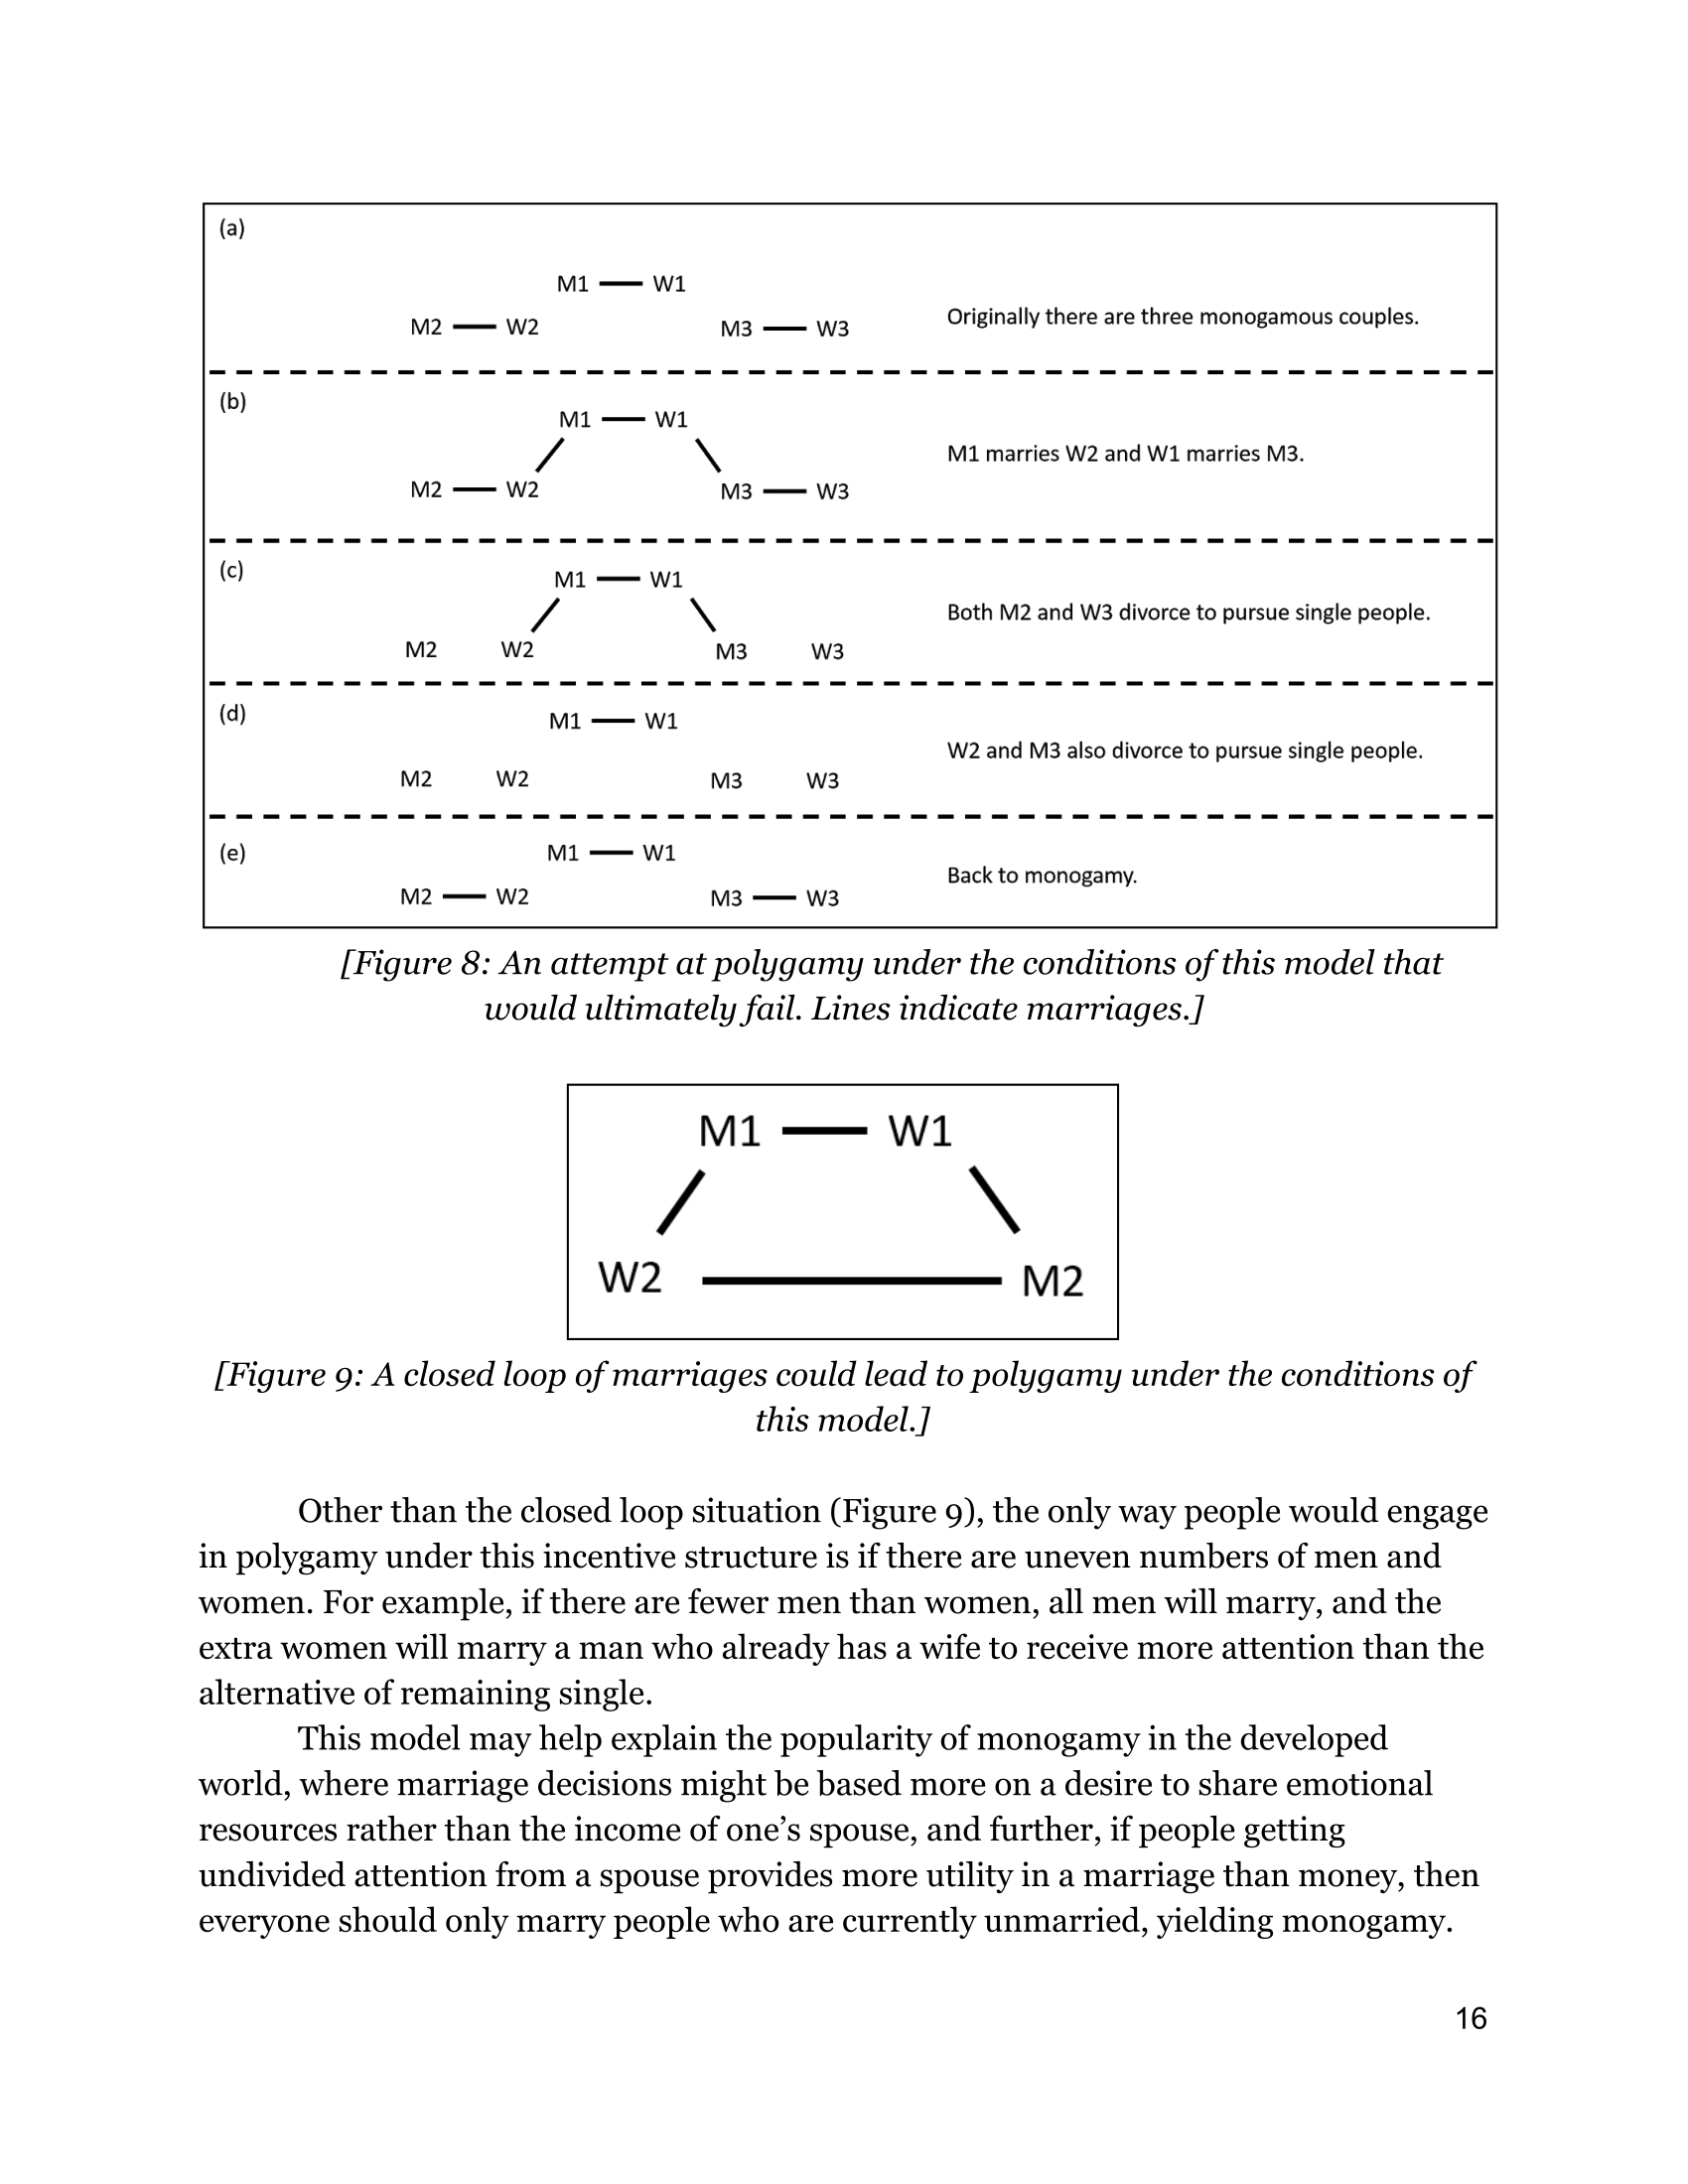
Lines connecting two squares represent marriages.
The squares move randomly.
When a red and blue square collide, they will get married if doing so will benefit both parties under the incentive structure selected.
A red and blue square will divorce if doing so will benefit either party.
The graph along the top shows how many spouses each square has. The bars in the graph represent squares, arranged according to size (income).
The list under the graphic dynamically lists marriages and divorces as they occur.
This list will be different each time you run the model because the order in which squares collide changes,
even though every square will eventually collide with every other square.
Effects of Marriage Efficiency
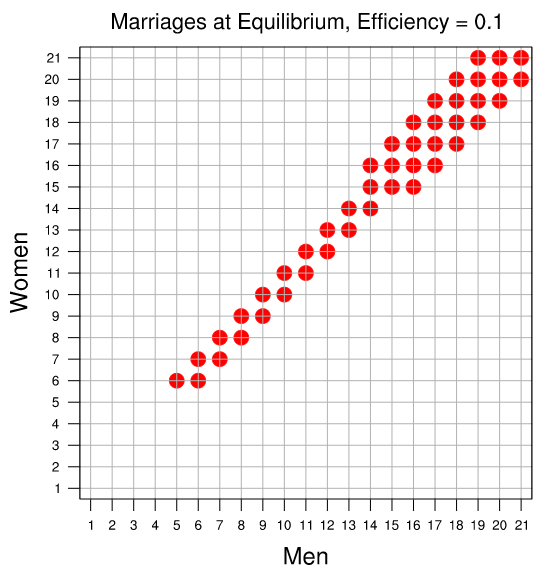
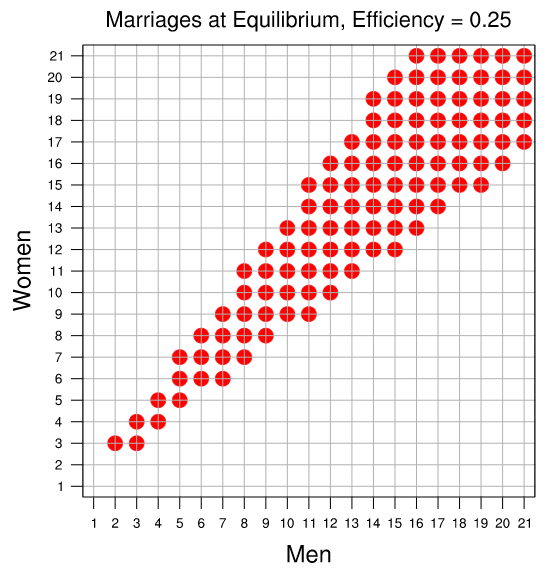
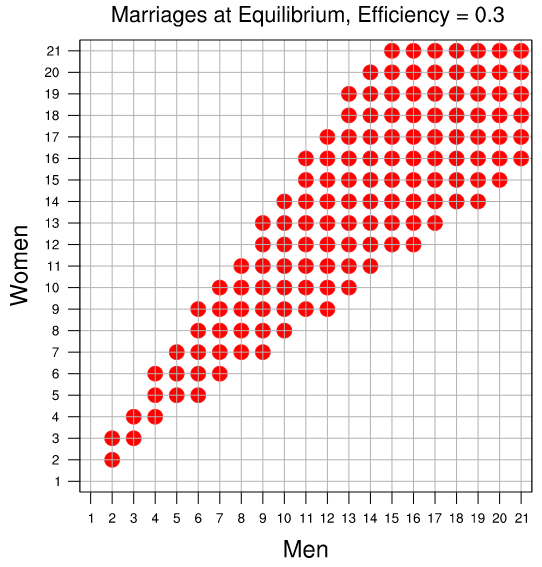
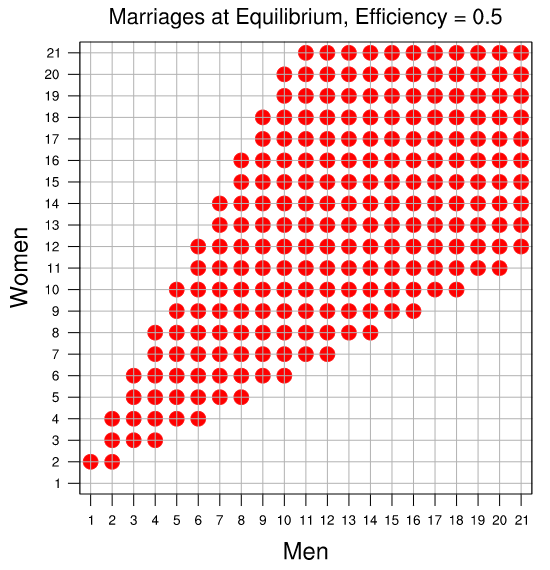
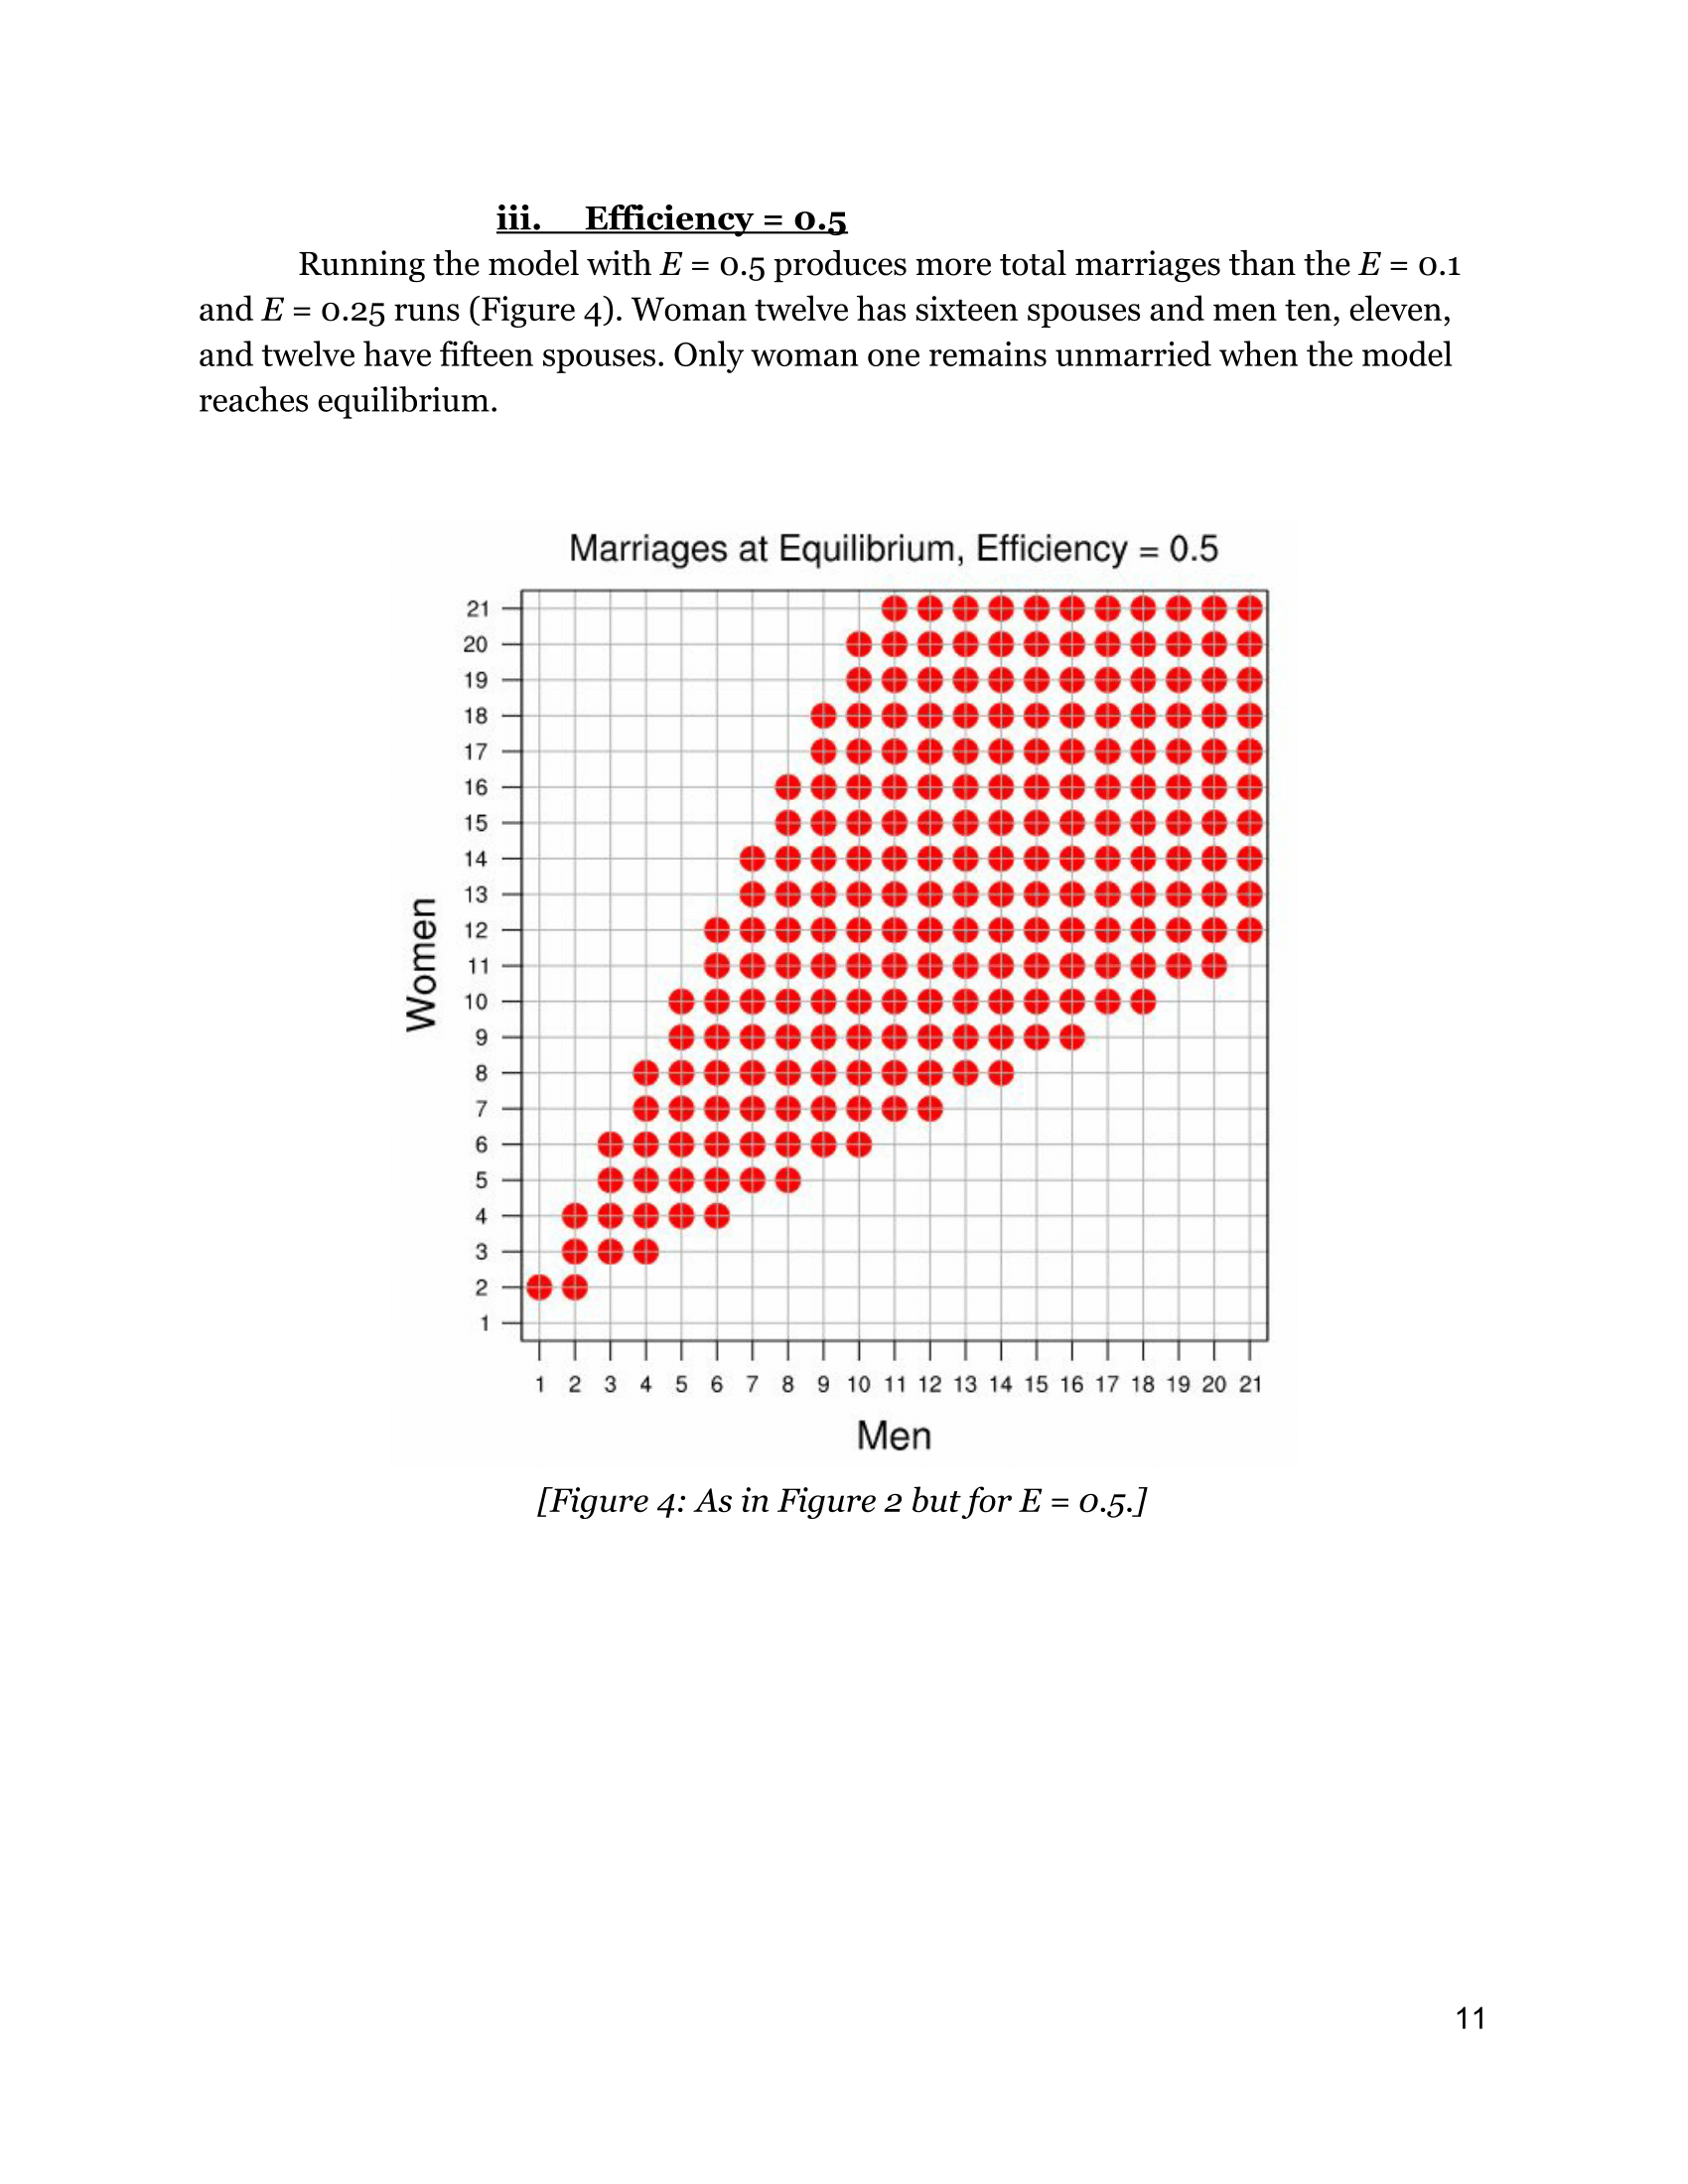
The models reach equilibrium when no one can improve upon their current marital arrangement.
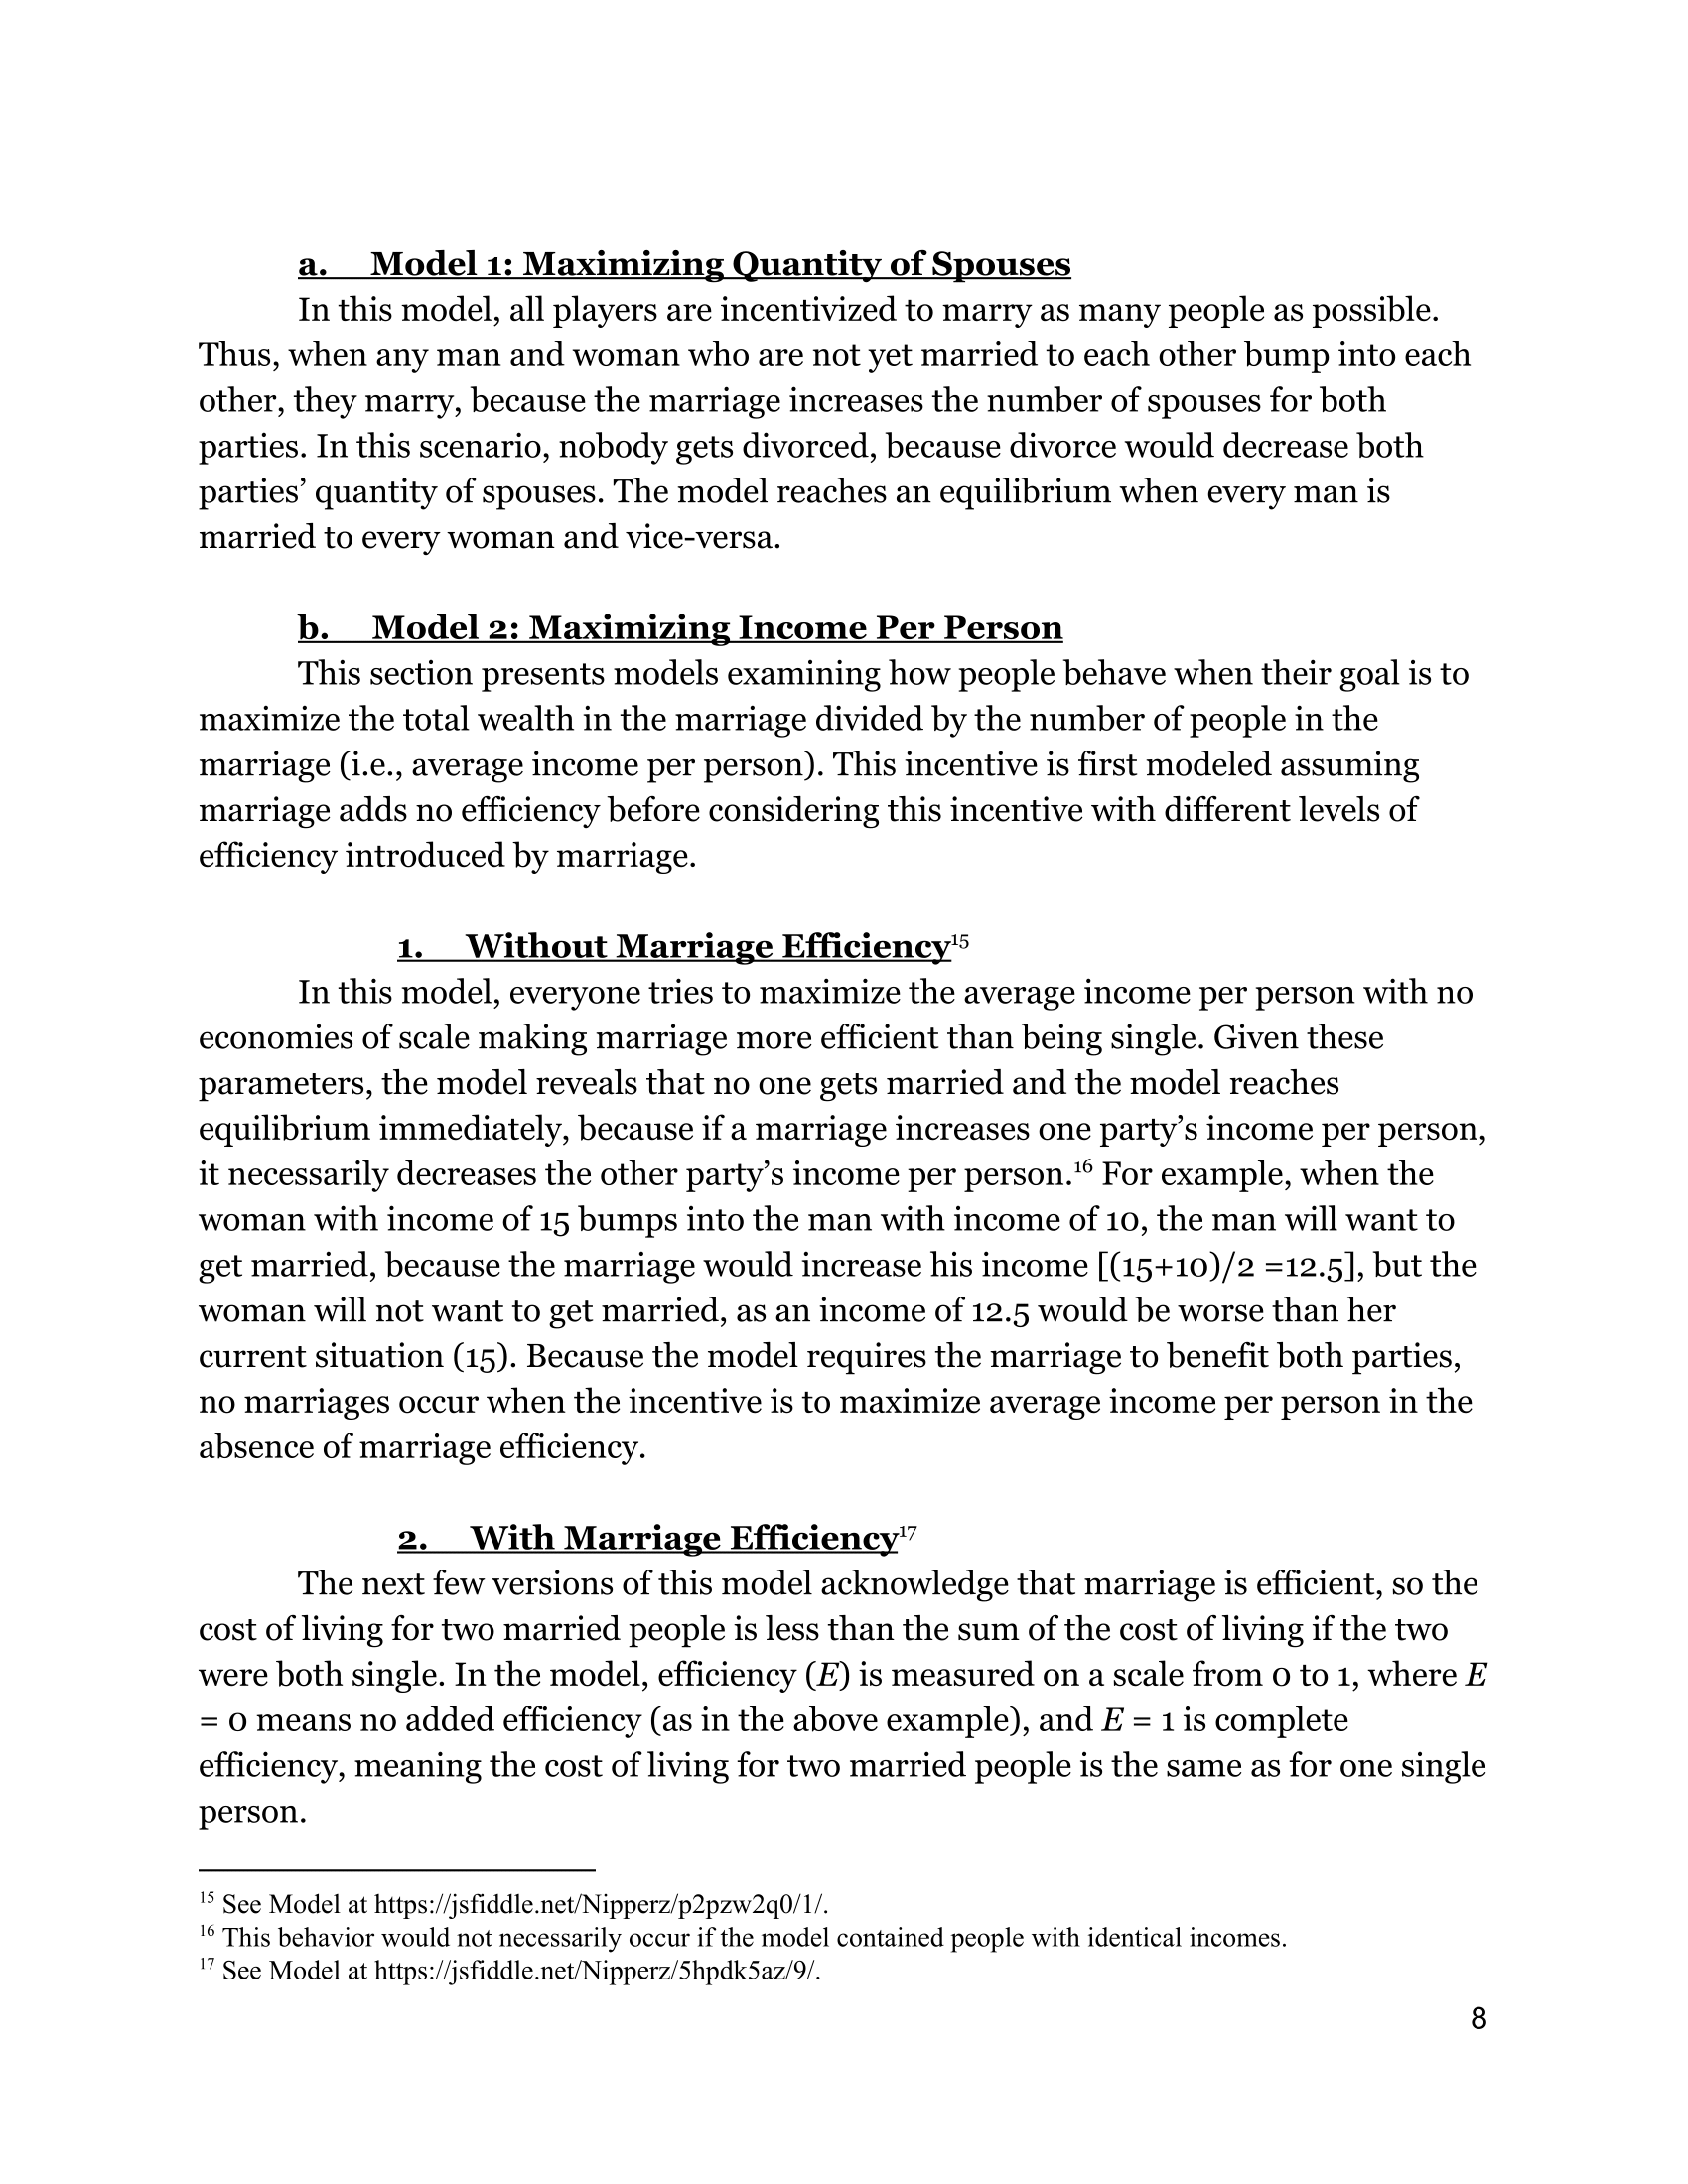
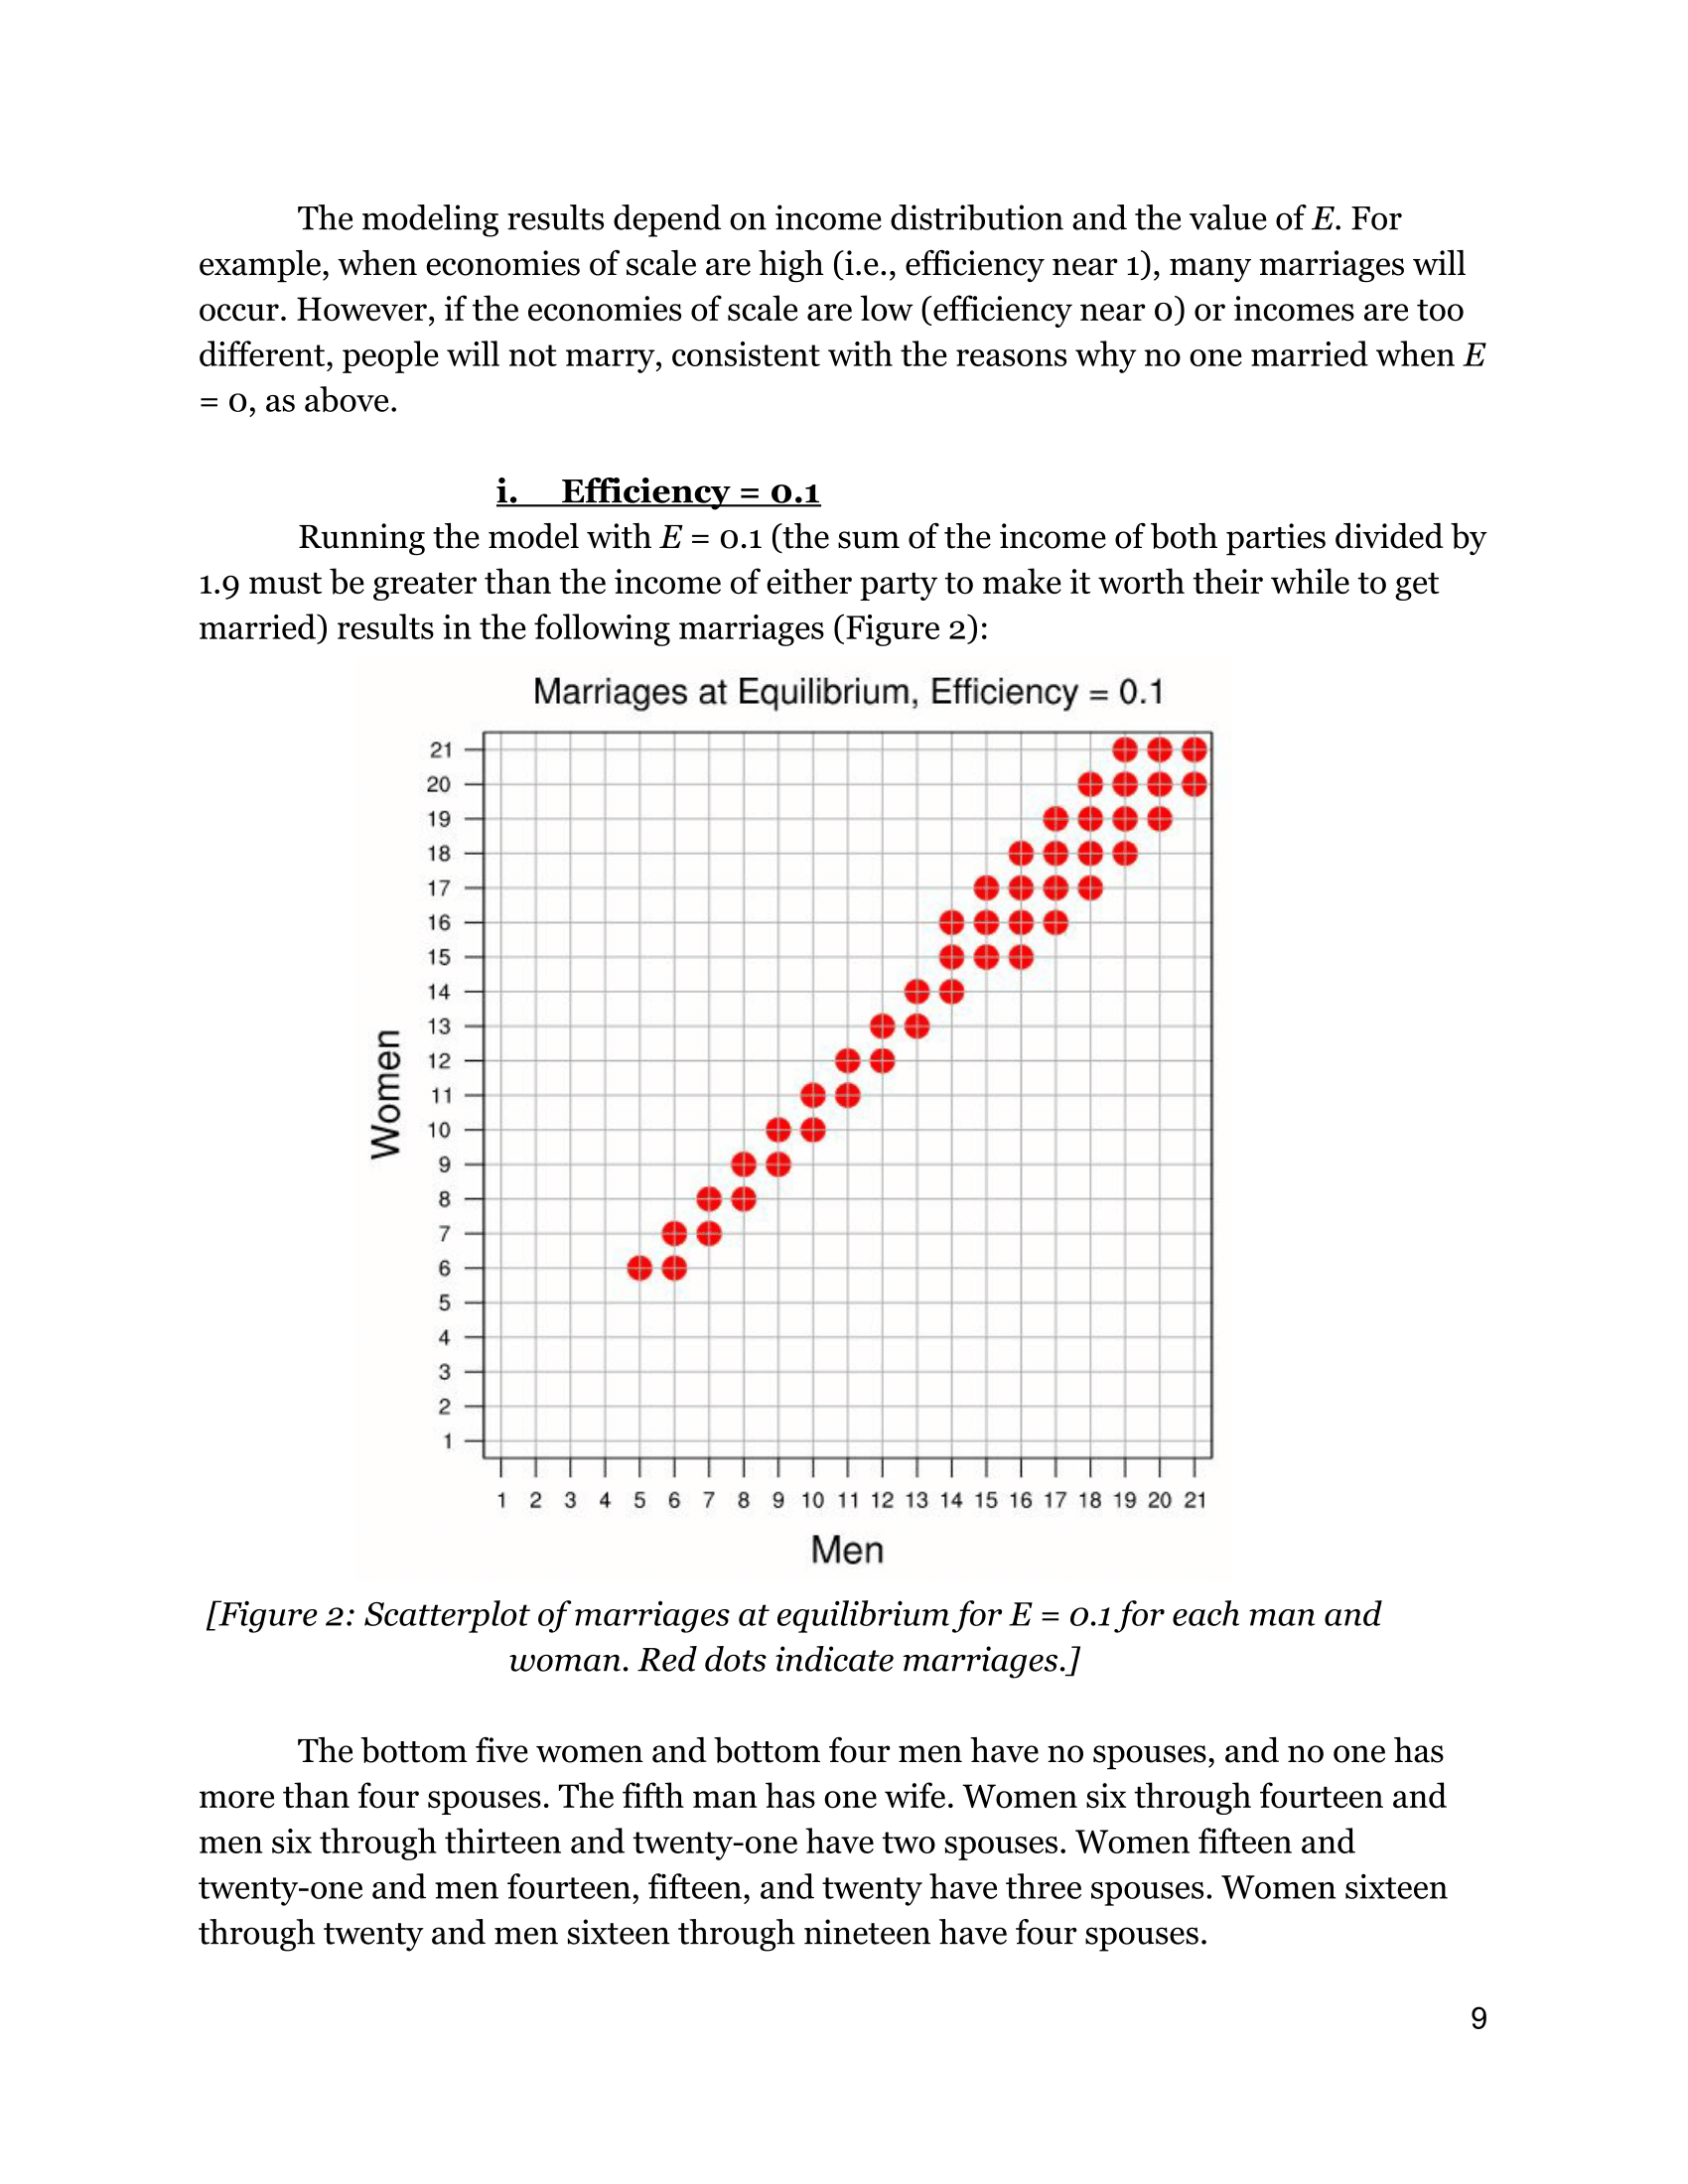
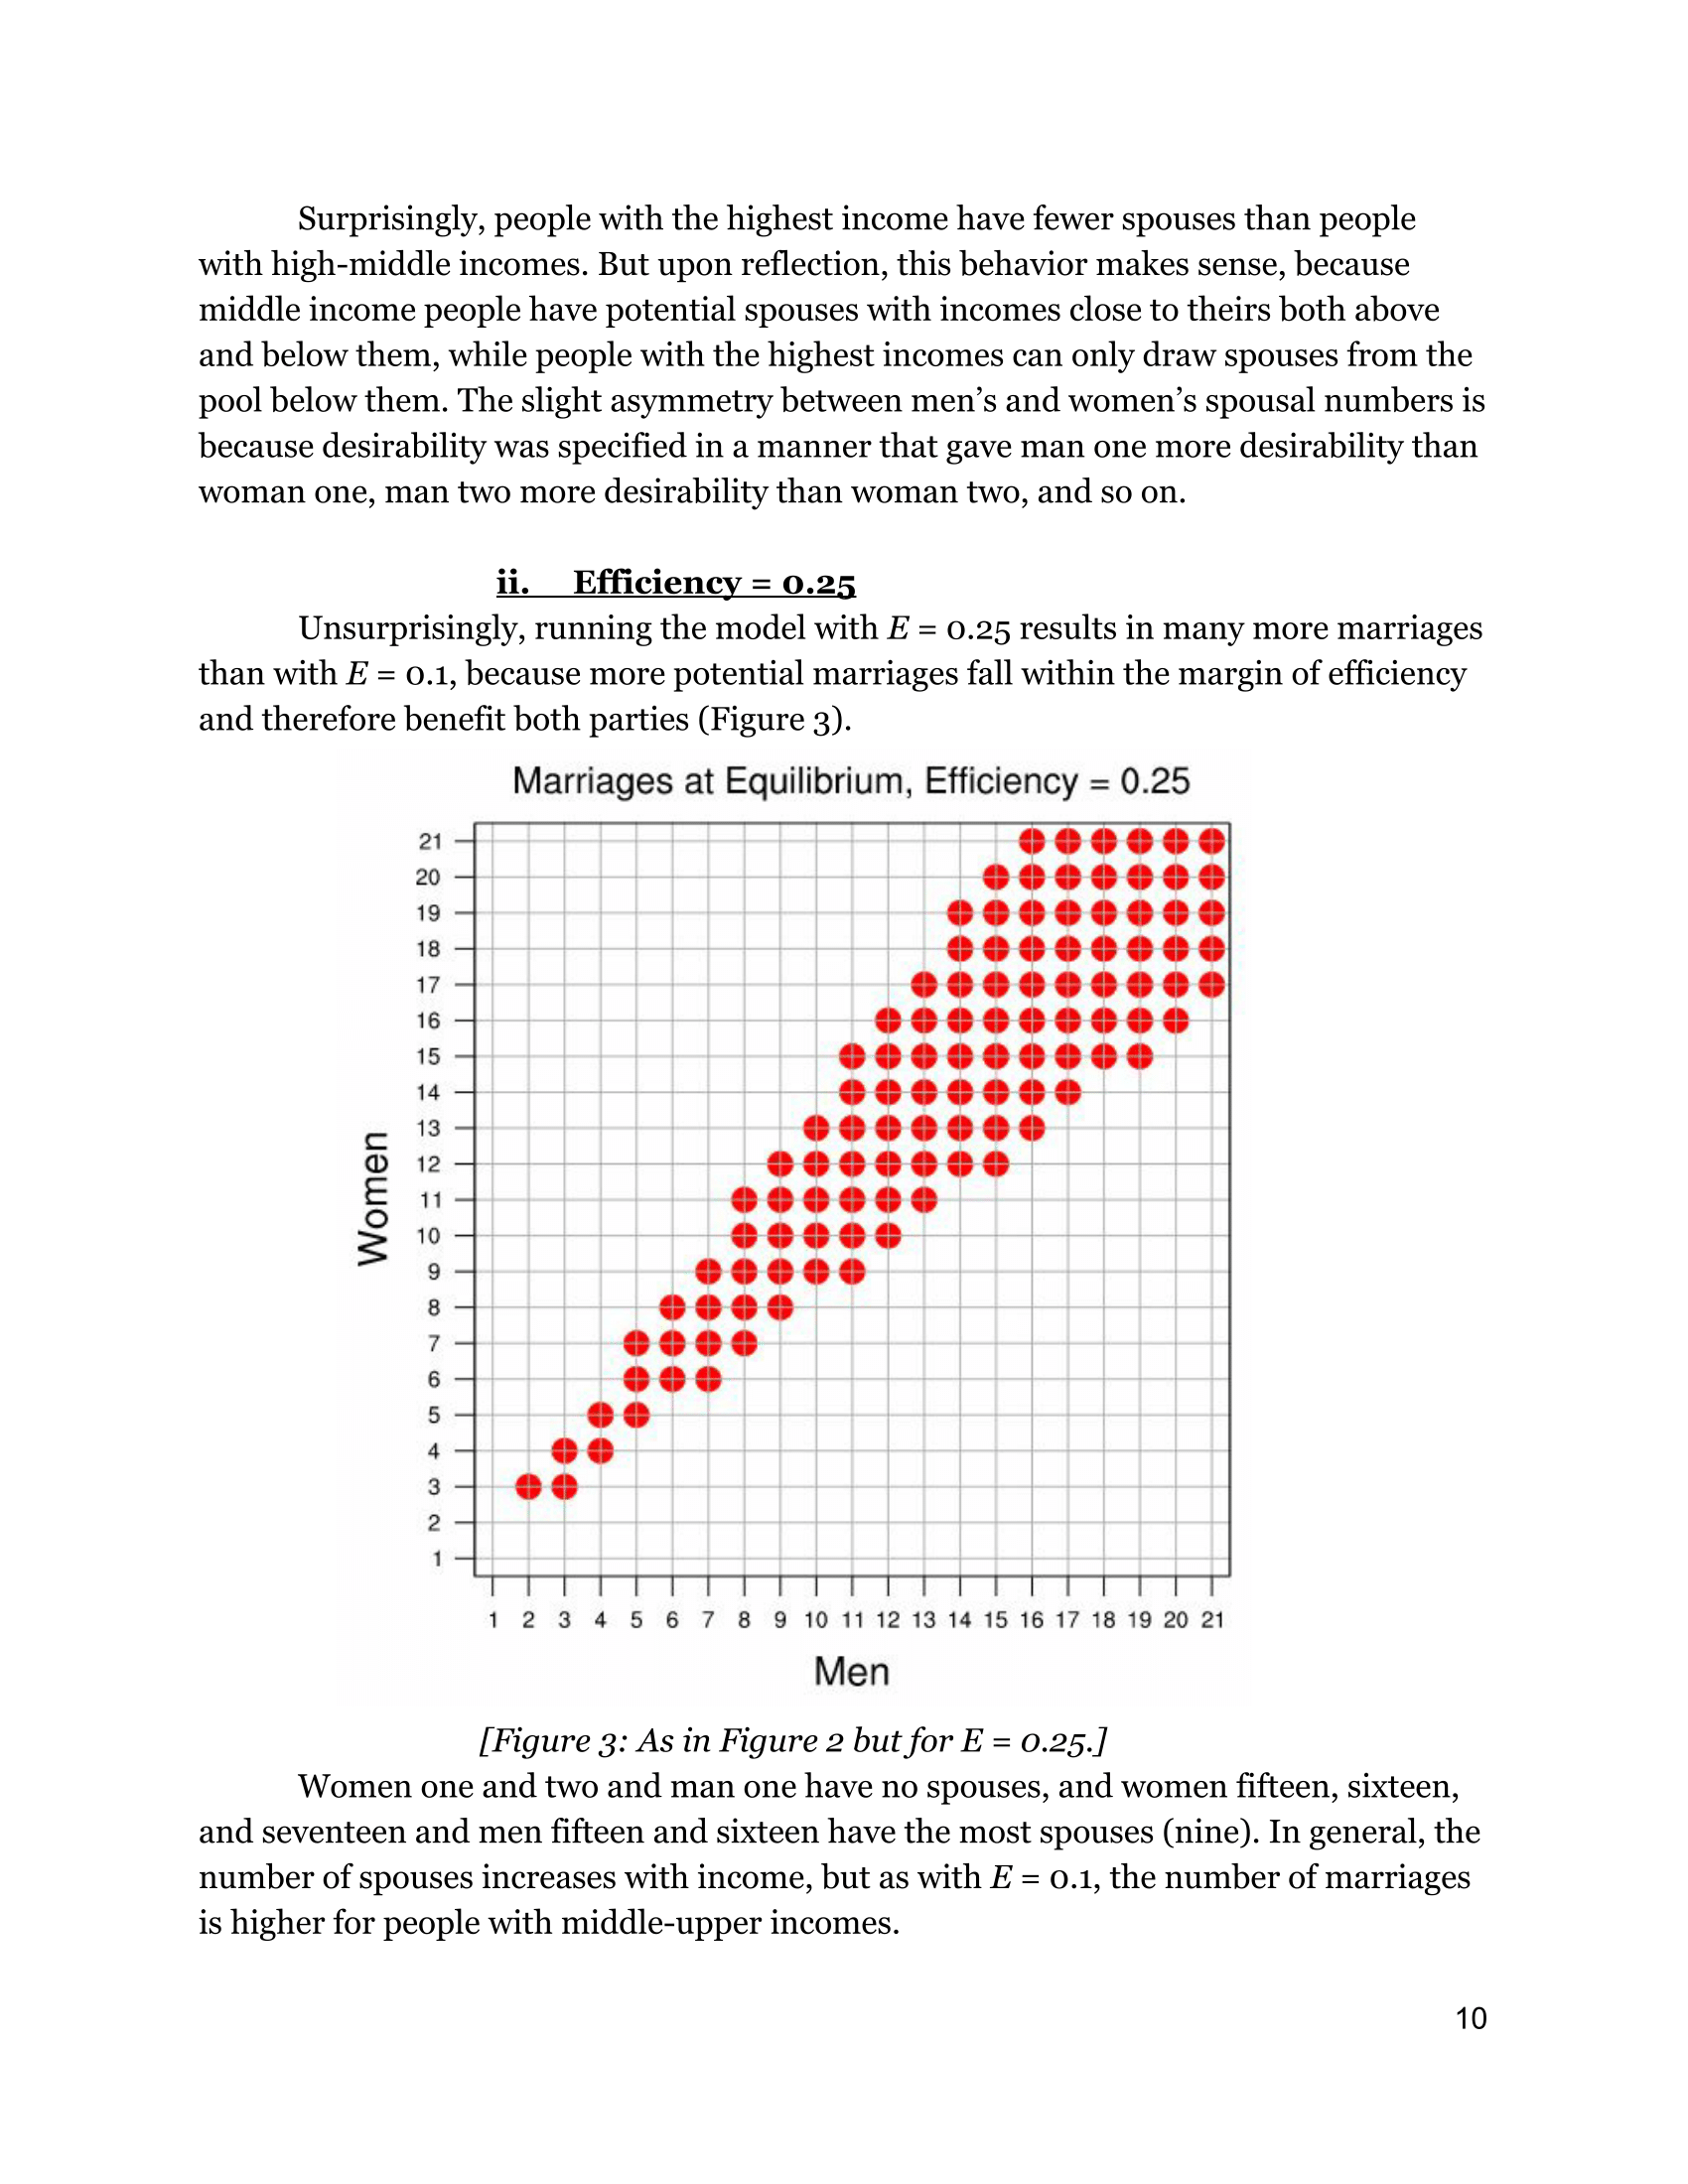
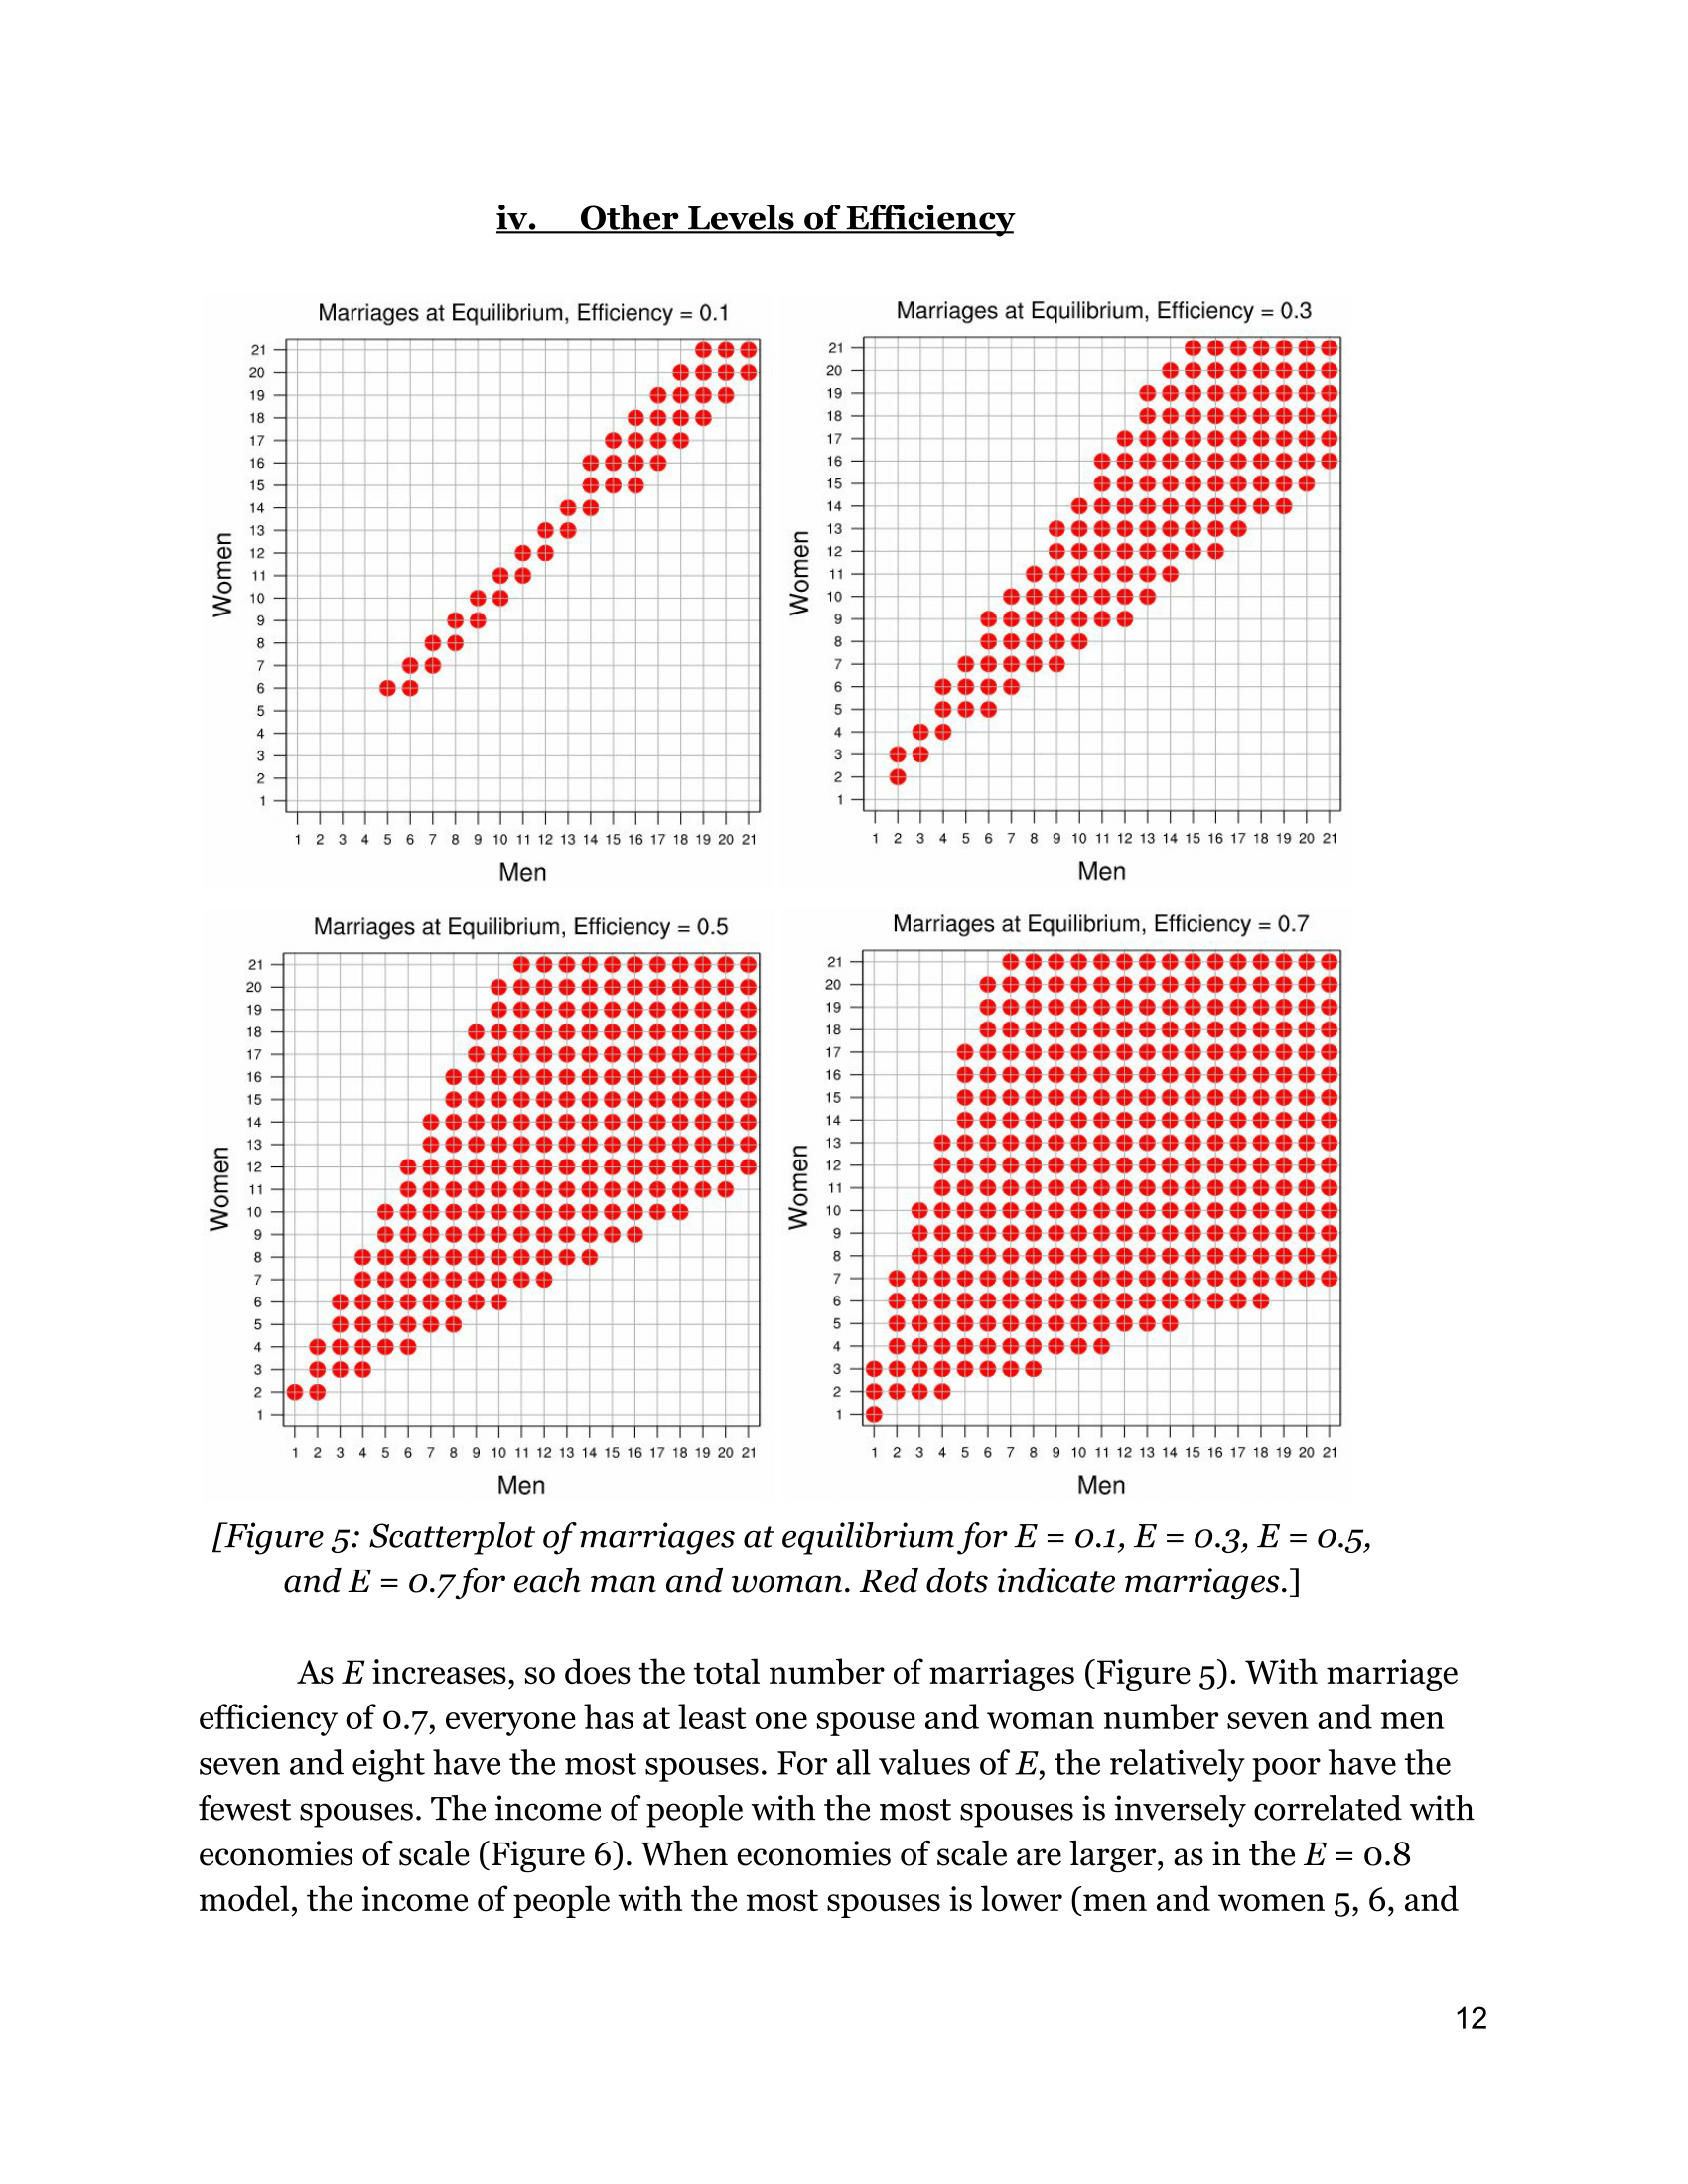
These plots show the marriages that exist when each model reaches equilibrium.
Each red dot represents a marriage between the man on the x-axis and the woman on the y-axis.
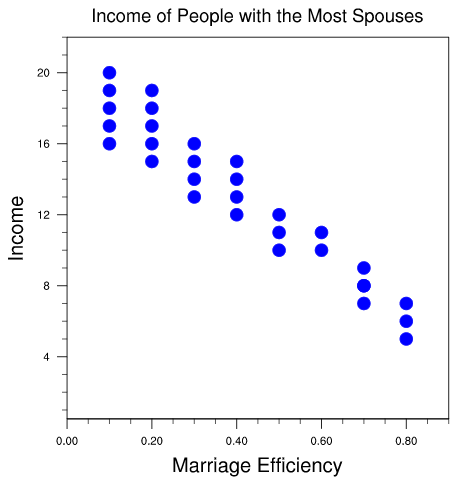
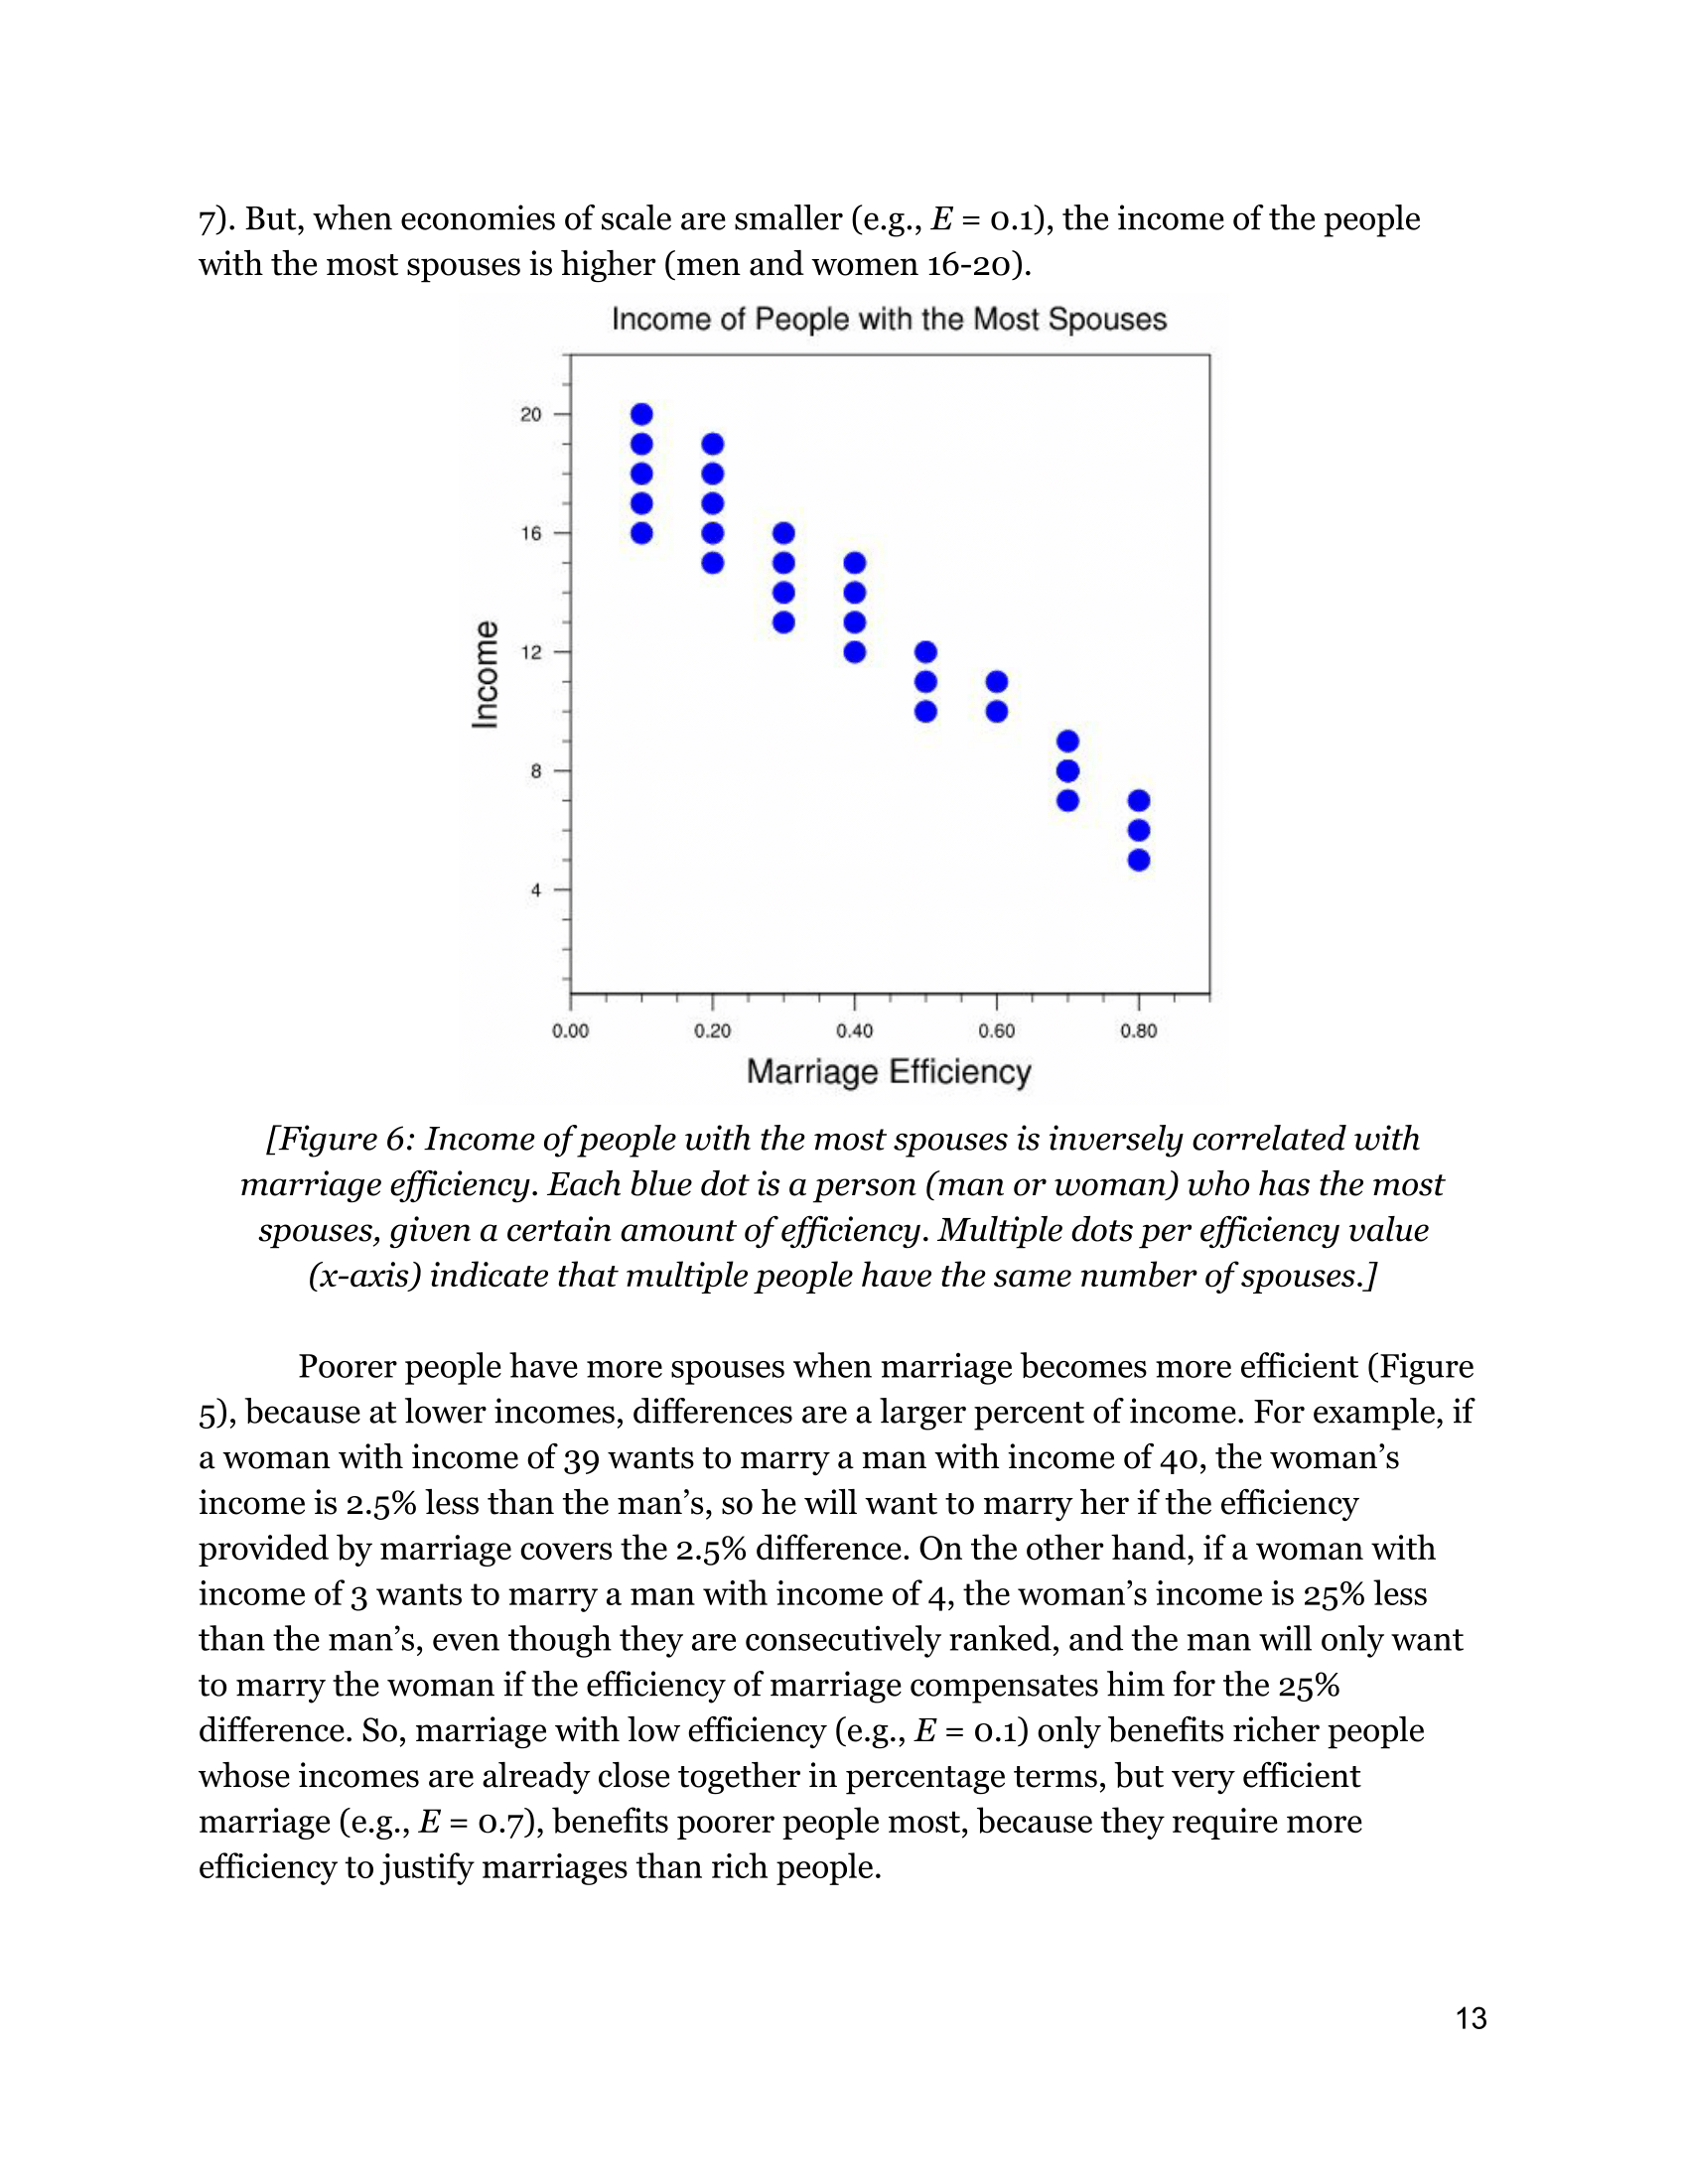
The blue plot shows the income of people with the most spouses at different levels of marriage efficiency.
Conclusions:
The more efficient marriage is, the more spouses people have.
The more efficient marriage is, the lower the income of people with the most spouses.
People with the lowest income benefit the least from marriage at every level of efficiency.